
- Ethereum price started a fresh decline from the $4,150 resistance against the US Dollar.
- ETH price is now trading just below $4,000 and the 55 simple moving average (4-hours).
- There is a crucial bullish trend line forming with support near $3,925 on the 4-hours chart (data feed from Coinbase).
- The pair could start a major decline if there is a clear break below $3,900.
Ethereum price is correcting from $4,150 against the US Dollar. ETH/USD remains at a risk of a sharp decline if there is a clear break below $3,900.
Ethereum Price Analysis
Recently, ethereum saw a fresh decline from well above $4,080 against the US Dollar. ETH price formed a high near the $4,150 level and started a major decline.
There was a move below the $4,050 and $4,000 support levels. The price traded below the 23.6% Fib retracement level of the upward move from the $3,659 low to $4,157 high. It is now trading just below $4,000 and the 55 simple moving average (4-hours).
An immediate support on the downside is near the $3,925 level. There is also a crucial bullish trend line forming with support near $3,925 on the 4-hours chart.
The trend line is close to the 50% Fib retracement level of the upward move from the $3,659 low to $4,157 high. The next major support is now near the $3,850 level, below which the price could test $3,750. Any more losses could lead the price towards $3,500.
On the upside, the price is facing resistance near the $4,000 level. The main hurdle is now forming near the $4,020 level and the 55 simple moving average (4-hours). Any more gains could send the price towards the $4,150 level. The next major stop for the bulls could be near the $4,250 level.
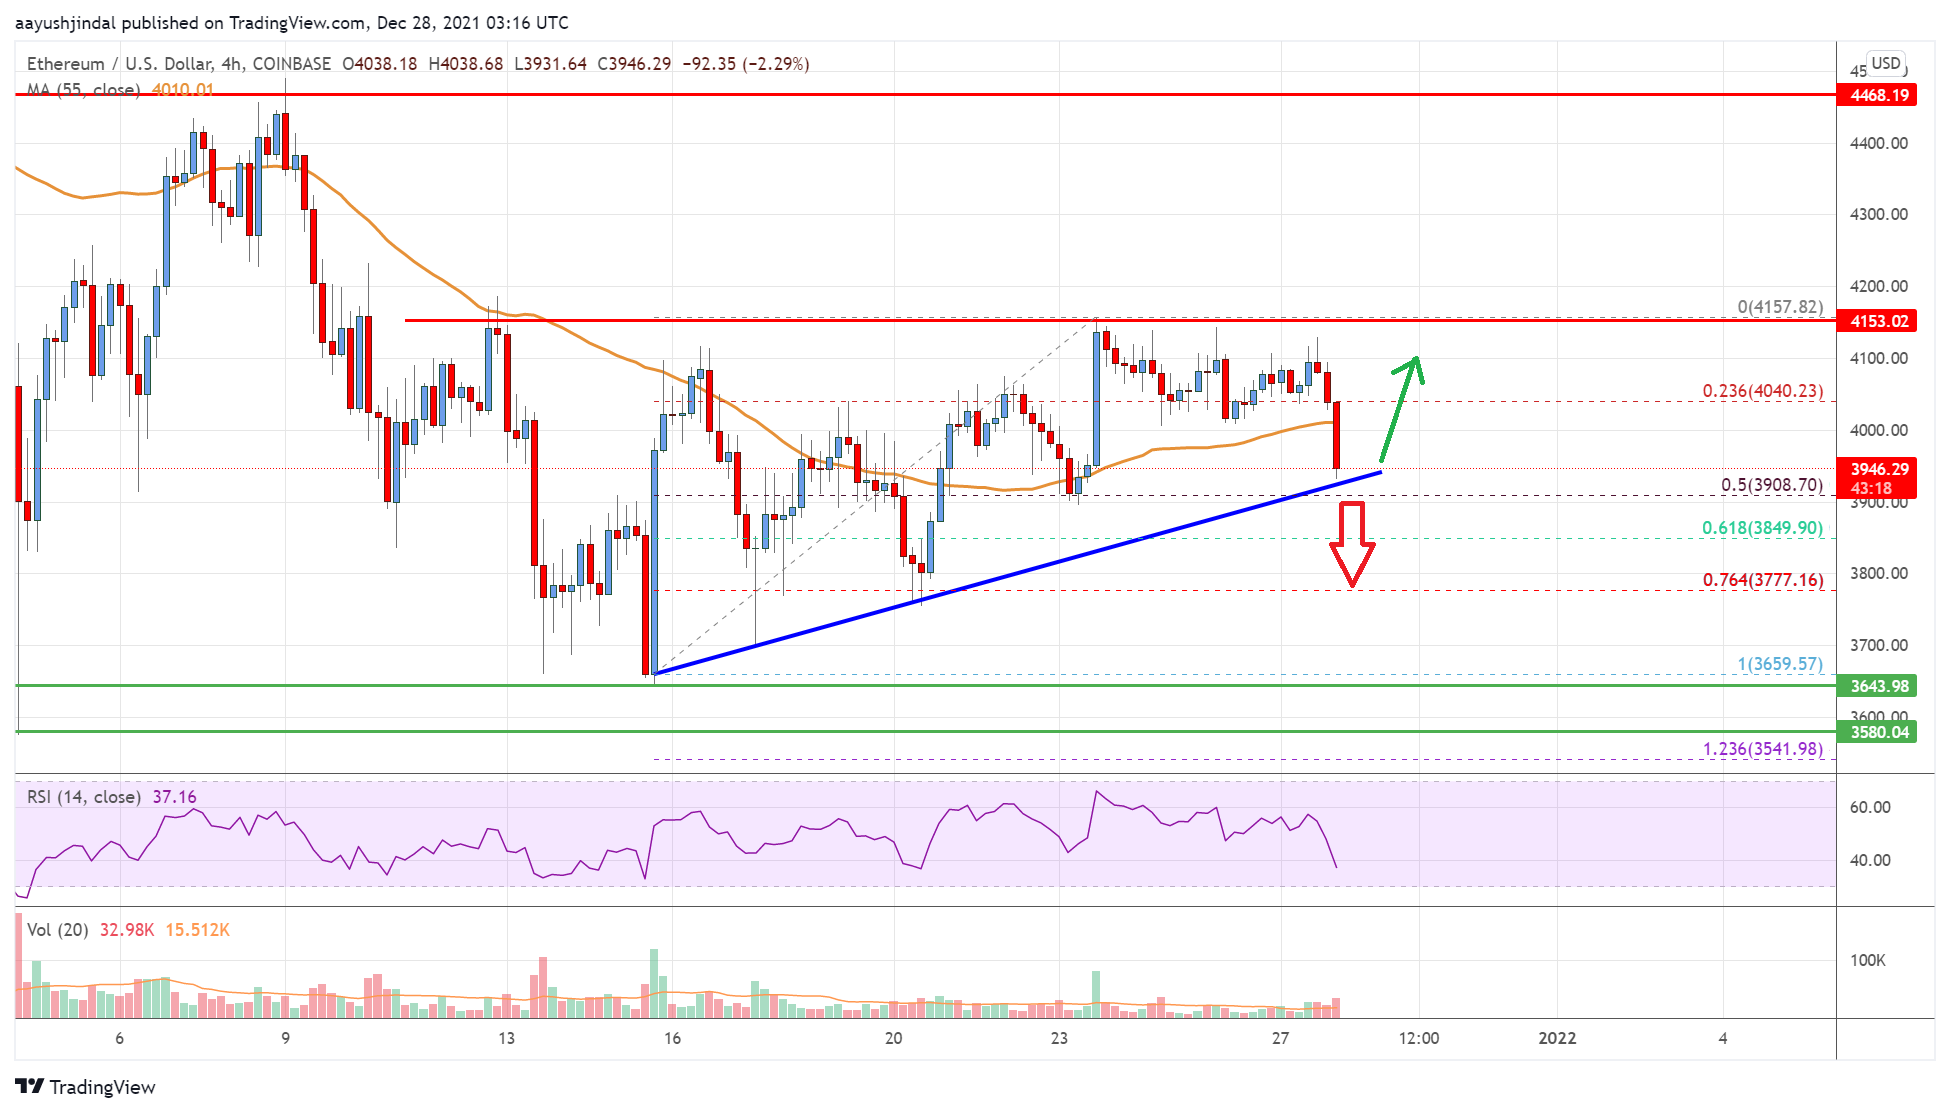
Looking at the chart, Ethereum price is clearly trading below the $4,000 zone and the 55 simple moving average (4-hours). Overall, ether price could start a major decline if there is a clear break below $3,900.
Technical indicators
4 hours MACD – The MACD for ETH/USD is slowly gaining momentum in the bearish zone.
4 hours RSI (Relative Strength Index) – The RSI for ETH/USD is now below the 50 level.
Key Support Levels – $3,925, followed by the $3,750 zone.
Key Resistance$ Levels – $4,000 and $4,150.


Leave a Reply
You must be logged in to post a comment.