 Emily John·September 20, 2026

ADA price jumped 11% from Sunday’s open and now leans on a descending line that has capped Cardano rallies since March. Here is the full top-down read.
ADA spent most of Saturday doing almost nothing. Four-hour volume on Binance spot ran between 7 and 19 million tokens, and the whole day traded inside 0.2428 to 0.2487.
Sunday evening changed that. The four-hour bar that opened at 20:00 UTC on 4 October printed 89 million ADA, against 11 to 13 million in the quiet morning bars. The day closed at 0.2597.
The ADA price traded near 0.272 at 13:00 UTC on Monday 5 October, up 11.6% from the Sunday open of 0.2438. Bitcoin gained 1.4% over that window and Dogecoin 3.0%. Monday’s high so far, 0.2768 as of 13:35 UTC, poked about 2% over a descending line that joins the 18 March and 10 May highs.
Nothing published on Sunday explains the timing, and the wider altcoin market sat nearly flat. The news flow behind ADA is about a week old, which makes the ADA price move hard to pin on any one item.
RealFi went live on Cardano mainnet on Thursday 1 October with a reserve-backed dollar, USDrf, and a staked version, sUSDrf, paying yield from real-world assets. The Cardano Foundation announced a multi-year partnership with the UCLA Anderson Venture Accelerator on Monday 28 September. Two Petrobras research apps for renewable fuel claims followed on Wednesday, 30 September. On Monday 21 September, Cardano joined the x402 payment toolkit, so apps and AI agents can pay for API calls in ADA. Each is a possible driver of the ADA price, and none is a confirmed trigger.
T. Rowe Price gets named too. Its prospectus supplement dated Wednesday, 9 September lists ADA as an eligible asset with a 2.63% index weight. It is an eligibility list, and the filing says nothing about a purchase.
DefiLlama put Cardano DeFi TVL at $65.1 million on Sunday, 4 October. That is about 91% under the $721 million peak of December 2024. The page showed $71.1 million on Monday, up 9% in 24 hours.
Stablecoin supply on the chain was $67.1 million the same day. At the current ADA price, the market cap reads $10.2 billion on that page. Whether RealFi moves those numbers is something only the next few weeks of data can answer.
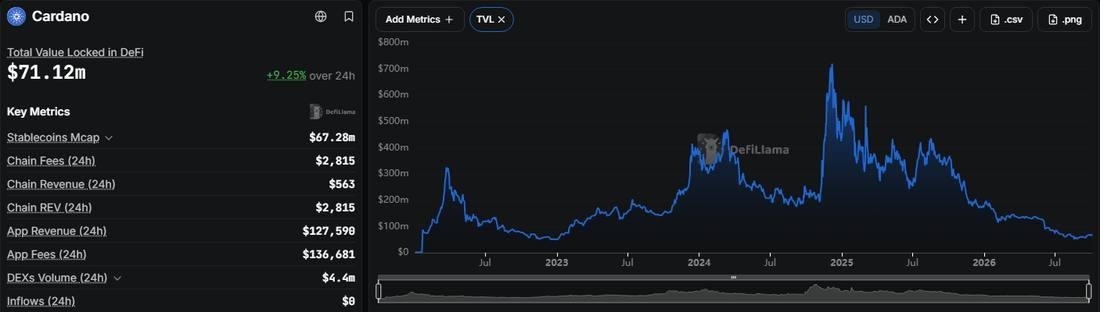
DefiLlama’s Cardano page on Monday, October 5, showing DeFi TVL, stablecoin market cap, and ADA market cap. Source: DefiLlama
Zoom out, and the ADA price chart is a staircase down on the weekly timeframe. Highs step from 1.3264 in the week of 2 December 2024 to 1.0193 in the week of 11 August 2025. The latest, 0.2887, came on Sunday 10 May 2026.
The slide ended at 0.1382 on Thursday 25 June, and ADA has nearly doubled since. Weekly lows have climbed from 0.1712 in the week of 17 August to 0.1903 and then 0.2369 last week. A weekly close above 0.2887 would take out the last lower high on this chart, which makes it the structure break worth watching.
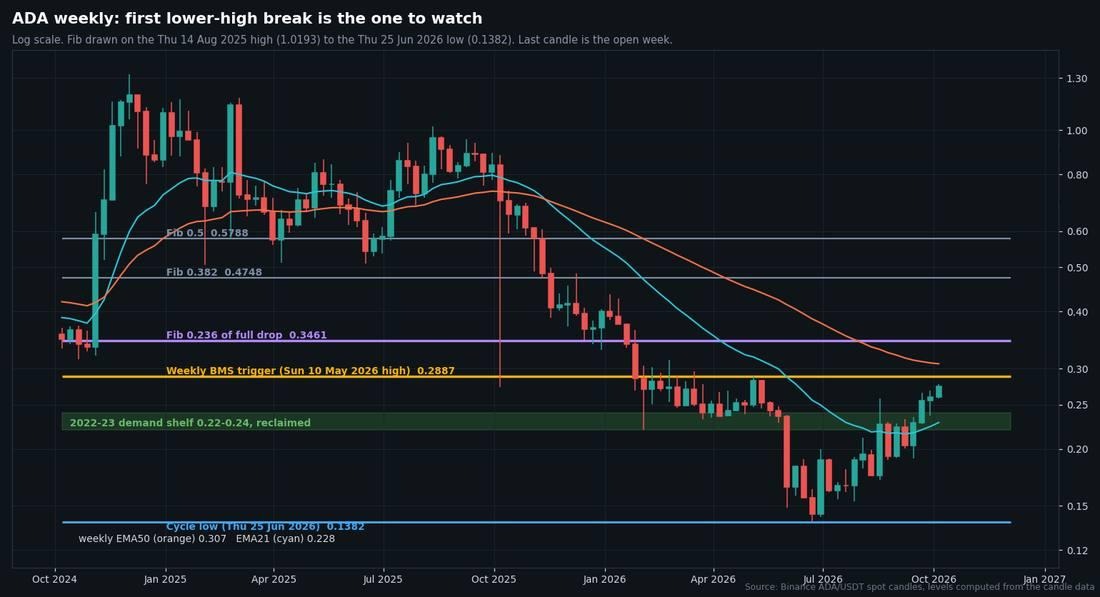
ADA weekly candles on a log scale with the Fibonacci levels, weekly structure level, demand shelf, and weekly averages. Source: Binance
Fibonacci levels drawn from the 14 August 2025 high of 1.0193 down to that 0.1382 low put the 0.236 retracement at 0.3461. That sits just above the 0.3136 high from Wednesday, 25 February. The 0.382 level is far off at 0.4748.
The ADA price has also climbed back above the 0.22 to 0.24 shelf. Weekly lows held there through 2022 and 2023 before June’s drop broke it. Monthly closes tell the same story slowly, with 0.1682 in July, 0.1978 in August, and 0.2466 in September. ADA now trades above every monthly close since March, though February’s 0.2810 is still overhead. The weekly 21-period average, 0.228, is now under price, while the 50-period one at 0.307 is still above it.
The daily candles from 29 September to 3 October were tiny. Five in a row, ranges overlapping. Every one closed between 0.2438 and 0.2466, right on top of the 200-day EMA near 0.24. In candle terms, that is indecision.
Sunday 4 October then printed a bullish engulfing candle, opening at 0.2438 and closing at 0.2597 with a high of 0.2685. Monday’s candle is still open but trades above that close. The last daily close above the current ADA price came on Monday 11 May, at 0.2804.
Two trendlines frame the daily chart. The descending one joins the 18 March and 10 May highs and sits near 0.2705 on Monday. The rising one joins the 28 July and 16 September lows and runs near 0.207, far under price. The 20-day average at 0.243 and the 50-day at 0.225 both sit beneath price too. Daily RSI was 70.6 when checked at 13:35 UTC.
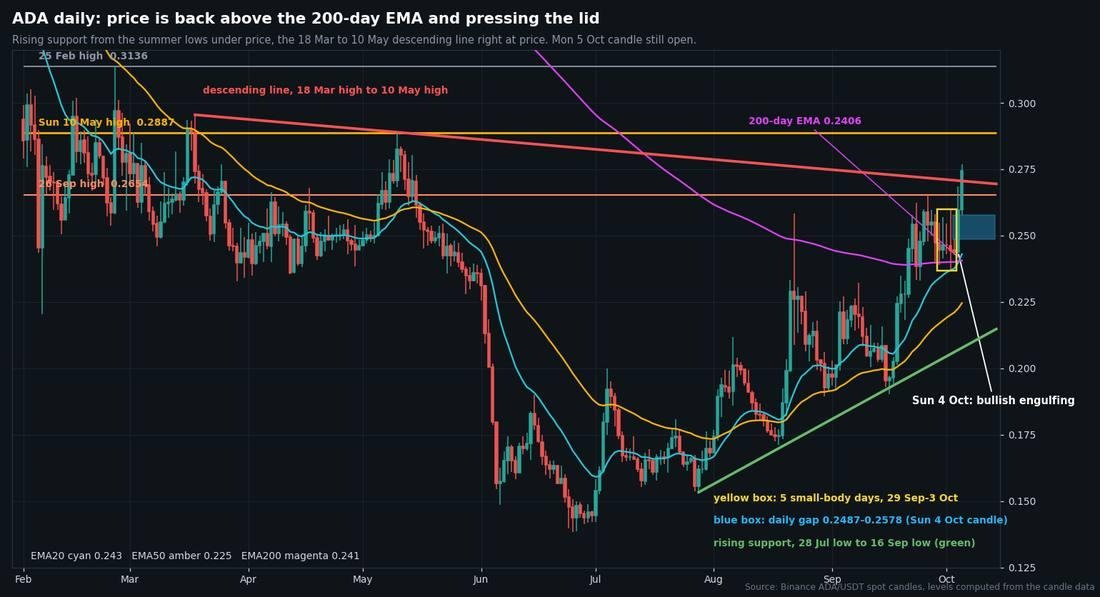
ADA daily candles with the descending and rising trendlines, the three moving averages, the daily gap and the five-day coil, as of Monday, October 5. Source: Binance
On the four-hour chart, the coil looks like an ascending triangle. The top is flat at 0.2654, the high of Saturday, 26 September. The floor rises slightly, from 0.2329 on Thursday, 24 September to 0.2369 on Friday, 2 October. The triangle’s height is 0.0325, which projects a measured move to about 0.2979. Ranges tightened elsewhere too, as the Doppler Finance XDP range showed over the weekend.
That Friday low came in the 16:00 UTC bar. The ADA price dipped under the 0.2389 and 0.2395 lows of 29 and 28 September, where stop orders tend to sit. The bar closed at 0.2396, just back above both. ICT traders call that a liquidity sweep. After that, it went sideways for about a day and a half, right up until Sunday’s volume spike.
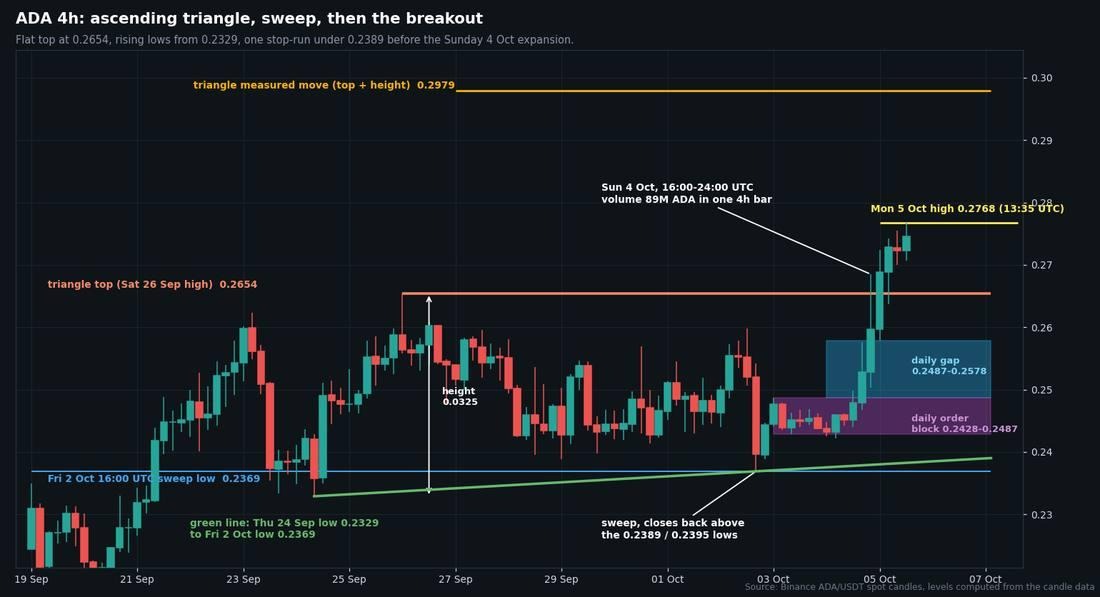
ADA four-hour candles with the triangle, the Friday sweep low, the daily gap, the order block, and the measured-move level, as of Monday, October 5, 13:35 UTC. Source: Binance
The expansion left two zones behind. A daily gap between 0.2487 and 0.2578 marks where price jumped without trading. Saturday’s daily candle, the last down candle before the move, spans 0.2428 to 0.2487. In ICT terms, those are a fair value gap and an order block. They describe where price moved fast and promise no bounce.
Buy-side liquidity, the clusters of stop orders above old highs, sits at 0.2887 from 10 May and 0.2955 from 18 March, with 0.3136 behind them. Under price, the nearest stops sit at 0.2578, Monday’s low so far at 13:35 UTC. Two more shelves wait lower, at 0.2369 and 0.2329.
That leaves the ADA price far above 0.2135, the midpoint of the 0.1382 to 0.2887 range. ICT readers call that premium. The 0.236 retracement of the current leg, from 0.1382 up to Monday’s high, lands at 0.2441, inside the order block.
Positioning is a snapshot, not a forecast. As of 12:00 UTC on Binance perpetuals, funding printed 0.01% on the last three readings. Open interest stood at 414.9 million ADA against a 30-day high of 436.4 million, and 67.7% of accounts were long.
The upside path triggers on a four-hour close above 0.2768, Monday’s high as of 13:35 UTC. That opens 0.2887 first and then 0.2979, the measured move. A four-hour close back under 0.2654 cancels it.
The downside path triggers on a four-hour close below 0.2578. That points to 0.2487, the bottom of the daily gap, and then 0.2428. A four-hour close back above 0.2654 cancels it.
ADA sits above its own 20-day high, and Bitcoin, at 85,904 as of 12:00 UTC, is well over its rising 100-day average of 71,534. That regime is the one supported by tested evidence, and it favors the upside path. Neither trigger has fired, so the ADA price is balanced between them for now. The strongest case against the breakout is the weekly chart, where 0.2887 and 0.3461 are still overhead. This is a technical read of the chart and not financial or investment advice.
Related News
Explore more