 Samuel·2d ago
Session snapshot for 7 July 2020. This is a dated market note, not a reprint of earlier analyses that used the same headline.
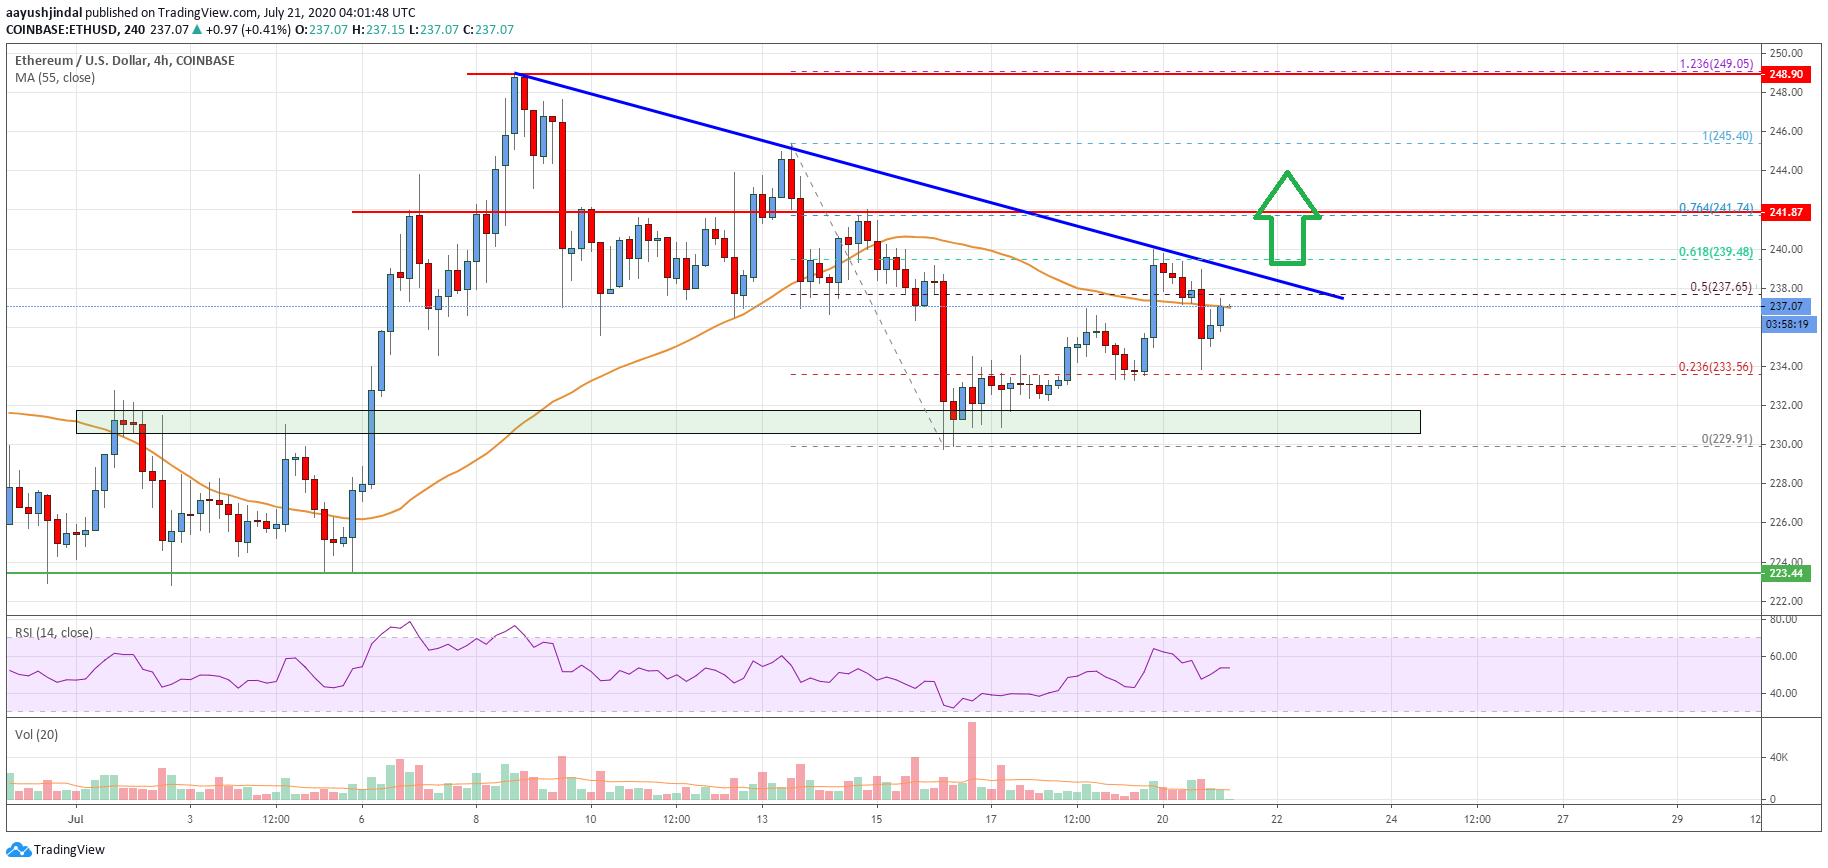
Ethereum price is trading with a bullish bias above $234 against the US Dollar. ETH/USD must stay above $232 to continue higher towards the $250 and $255 levels.
In the past few days, Ethereum price formed a strong support base above the $222 level against the US Dollar. ETH price started a fresh increase and surpassed the $228 and $230 levels to move into a positive zone.
There was also a close above the $232 level and the 55 simple moving average (4-hours). During the rise, there was a break above a crucial bearish trend line with resistance near $230 on the 4-hours chart.
The pair gained pace above the main $234 pivot level and surged above $240. It traded as high as $244 and it is currently correcting lower. There was a break below the 23.6% Fib retracement level of the recent rise from the $223 low to $244 high.
On the downside, the first major support is near the $234 pivot level. It is also close to the 50% Fib retracement level of the recent rise from the $223 low to $244 high.
The next major support is near the $232 level, below which the bulls are likely to lose control in the near term. Conversely, the price might resume its rise after it completes the current correction wave near $234 or $232.
On the upside, an initial resistance zone is near the $242 and $244 levels. The main hurdle is near the $245 level, above which the bulls are likely to aim a strong break above the $250 level.
Looking at the chart, Ethereum price is clearly trading in a positive zone above the $234 and $232 levels. Therefore, it could soon resume its upward move towards $250 unless there is break below the $232 support.
4 hours MACD – The MACD for ETH/USD is slowly losing momentum in the bullish zone.
4 hours RSI (Relative Strength Index) – The RSI for ETH/USD is just above the 60 level.
Key Support Levels – $234, followed by the $232 zone.
Key Resistance Levels – $245 and $250.
Related News
Explore more