
 James Godstime·22hr ago

FET price sits near $0.23 after a 51% run, a $1.56M bridge exploit and a liquidation flush. Heatmap zones, levels and the AI-token backdrop, all dated.
FET price started last Sunday looking broken. At 07:00 UTC on September 20, the Artificial Superintelligence Alliance posted on X that an unauthorized party had withdrawn about $1.56M in FET from a token converter. The day’s low printed at $0.1671 on the Binance perpetual.
Then the FET price flipped. Monday’s candle ran 16.9% from open to close, and the week of September 21 finished at $0.2474, up 41%. Saturday, September 26 tagged a high of $0.2597.
FET isn’t a memecoin, to be clear.
It’s an AI-agent token with a product roadmap behind it. It’s just been swinging like a memecoin, which is why the FET price needs more than a chart and a guess.
The FET price wasn’t a straight line up. Wednesday, September 23 closed at $0.1941, under the $0.20 mark again. Thursday closed at $0.2286 and Friday, September 25 at $0.2466, then Sunday settled at $0.2474.
Monday, September 28 sold it off, with a range from $0.2493 down to $0.2208 and a close at $0.2246. Wednesday, September 30 put in the pullback low at $0.2128 before closing at $0.2290. As of 09:00 UTC on Thursday, October 1, the FET price sits near $0.234.
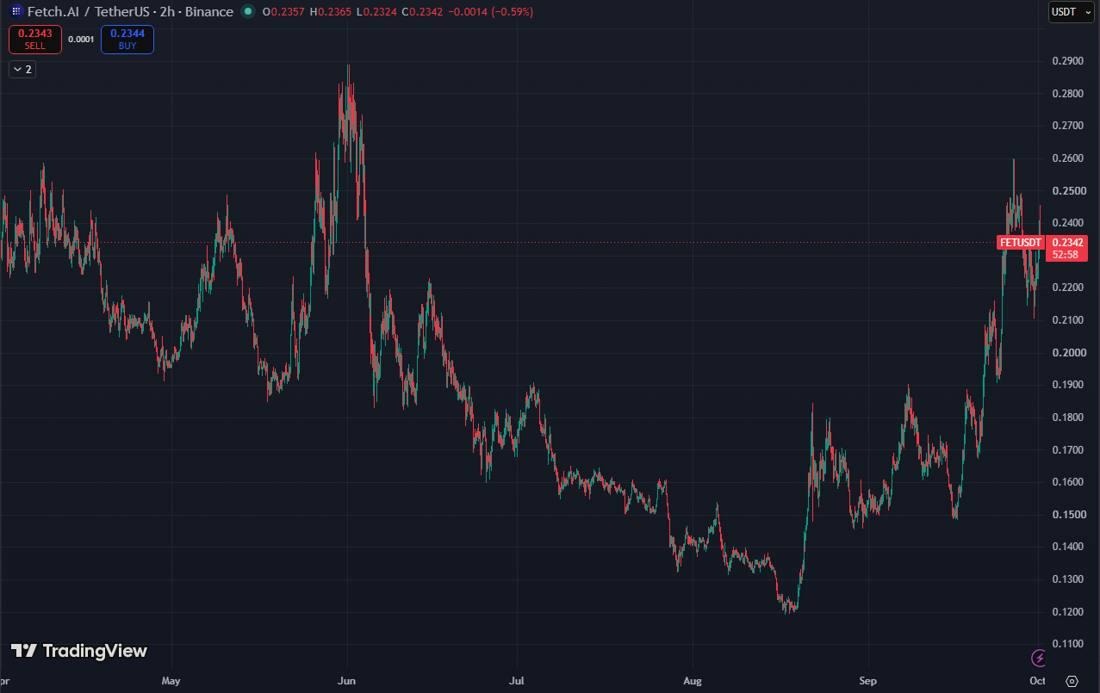
FET/USDT 2-hour chart, April to October 1, 2026. Source: TradingView
Did the exploit news move the FET price? Nothing checkable says that, and POSSIBLE is the most the evidence supports. AI tokens as a group ran too. From the September 1 close to 09:00 UTC on October 1, Binance perpetual data shows FET up roughly 51%, Bittensor’s TAO up 40%, Render up 35% and Virtuals up 19%, while Bitcoin gained about 8%.
A liquidation heatmap marks prices where traders using borrowed money get force-closed if price reaches them. Picture a map of other people’s stops, drawn from exchange data. Honestly it’s a rough estimate, and price doesn’t owe anyone a visit.
On CoinGlass‘s one-week view of the Binance FET/USDT perpetual, the brightest bands sat near $0.2335, $0.2305 and $0.2258, read off the price axis, which makes them approximate. They stop around Monday, September 28, right where price dropped through them. The chart draws a level as finished once price crosses it, meaning the biggest clusters were probably used up in that flush.
What’s still standing is thinner. A green band stacks up from roughly $0.2367 to $0.2405, only 1% to 3% above price. A stronger line shows near $0.263, just over the September 26 high. Below, a moderate band runs from about $0.2105 to $0.2120, a hair under Wednesday’s $0.2128 low, with faint stuff near $0.198.
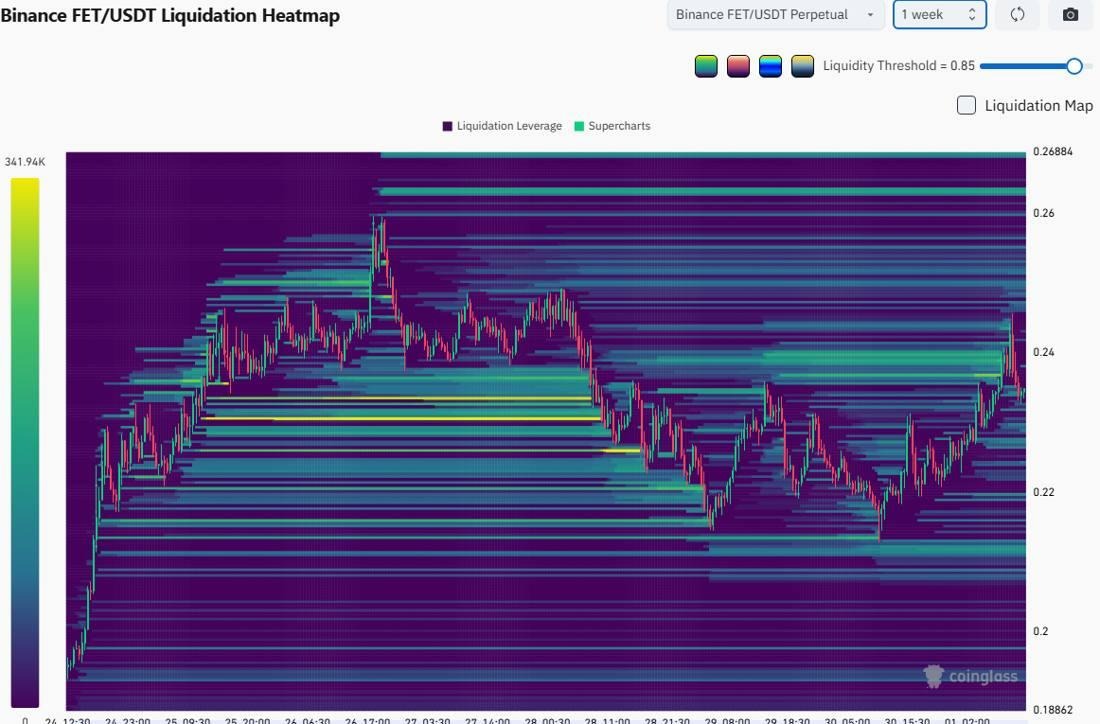
Binance FET/USDT one-week liquidation heatmap, logged Thursday, October 1, 2026. Source: CoinGlass
These are snapshots, no more. Funding printed 0.01% at the 08:00 UTC reading on October 1, which is Binance’s baseline rate. It went negative for two readings on September 29, at minus 0.027% and minus 0.055%.
Open interest was about $33.6M as of 09:00 UTC on October 1, against a 30-day peak near $35.8M. Taker buy/sell volume stayed under 1.0 every day from September 25 to 30, with a low of 0.895 on the 29th. And 63% of accounts were long on October 1, down from 70% on September 25.
The Alliance’s own site lists three members: Fetch.ai, SingularityNET and CUDOS. Products include ASI:Chain, billed as the first AI-native layer-1, plus ASI-1 Mini, a language model made for agent work, and ASI:Cloud, a GPU and inference service. ASI:Create was still in closed beta as of June.
The latest biweekly product update, Edition 15, covers September 5 to 18. ASI:Chain work went to longer node tests, cross-chain messaging and delegated staking, which is still in development. ASI:Create added agent logs, a global machine pool and plugins, and OmegaClaw got renamed Omega.
On the token side, CoinGecko ranks FET 110th with a $541M market cap and a $635M fully diluted value as of Thursday morning. About 2.31B of 2.71B tokens, roughly 85%, already circulate. The all-time high was $3.45 on March 28, 2024, and the price still sits 93% under it.
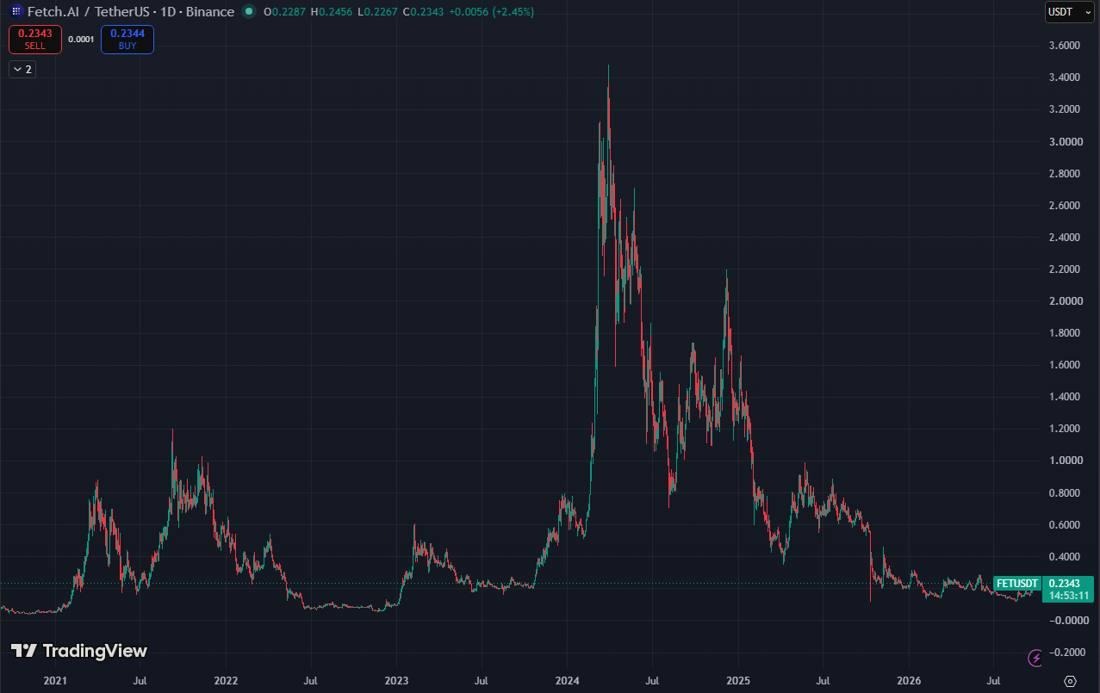
FET/USDT daily chart, full history on Binance. Source: TradingView
Put differently, a 51% month is a small step for the FET price on a chart that’s still 93% under its high.
About that exploit. The Alliance’s post says treasury and exchange wallets weren’t touched and that holders needn’t act. It also says other tokens in the same infrastructure were involved, without naming amounts, and it promised a full report once the investigation wraps. A search of the account on October 1 turned up no later post on it.
All four simple averages sit under the FET price. The 20-day average of closes is $0.1967, the 50-day $0.1705, the 100-day $0.164 and the 200-day $0.1916, all through Wednesday’s close. Daily RSI(14) reads 62 and weekly reads 58, short of the usual 70 line on both.
Volume tells the bigger story. Average daily volume over the seven days to September 30 ran about 1.8 times the 90-day average on the perpetual. Across those 90 days, most trading happened between $0.133 and $0.186, with the busiest price near $0.16. Very little changed hands in the gap between $0.186 and today’s price, which leaves little volume history to slow a move through that zone in either direction.
Measured from the June 1 high of $0.2888 to the August 17 low of $0.1191, the FET price sits between the 61.8% mark at $0.2240 and the 78.6% mark at $0.2525. Those lines describe the drop. They don’t predict anything, and they’re here to show where plenty of chart-watchers will have lines drawn.
A 1-hour close above $0.2484, the equal highs from Sunday, September 27, opens $0.2597, the September 26 high, with the heavier band near $0.263 behind it. That case is off if FET closes an hour back under $0.2374.
A 1-hour close under $0.2128, Wednesday’s low, points first at $0.2040, the halfway mark of the June to August drop, then $0.1902, the September 8 swing high. That case is off if FET closes an hour back above $0.2290, the October open.
Between those two lines, neither case is live, and that’s where the FET price trades right now. The scenario block is the whole call, and it’s balanced. The one input with tested backing is trend regime. Bitcoin sat at $83,531 as of 09:00 UTC on October 1, above its 100-day average of $70,514, while FET sits 9.9% under its 20-day high, which is inside its range and not a breakout.
Bitcoin’s own bear market clock hit day 359 on September 30 with price at $83,123 as of 08:00 UTC. CoinShares reported $3.55B of weekly inflows into crypto investment products for the week to September 29, the strongest of 2026.
The named breakdown covered Bitcoin at $2.52B, then Ether, Solana, and XRP. AI tokens weren’t singled out. Broad risk appetite is a POSSIBLE contributor to FET’s run and nothing more. Other altcoins have moved with it.
None of this is financial or investment advice. It’s a read of price, liquidity, and public project updates, current as of 09:00 UTC on Thursday, October 1, 2026, and any of it can go stale within hours.
Related News
Explore more