

Latest in Bitcoin
11,105
Total stories
47
Writers
Bitcoin Investors Face Hidden Costs as Inflation Keeps Interest Rates Elevated
17hr ago
Bitcoin at $10,000? History Challenges Crash Fears as ETFs Lose $82M
23hr ago
Standard Chartered Opens Bitcoin and Ethereum Trading to UAE Clients
4d ago
Bitcoin ETF Outflows Hit $679M as Wintermute Warns Crypto Has “Nothing Underneath”
4d ago
Bitcoin Guide: Price, Market Structure, Dominance, Mining, and Policy

When Bitcoin came onto the scene, it changed how people approached money in the sense of payments and even ownership. Before the OG cryptocurrency became mainstream in 2009, banks and payment companies handled all online transactions. Every transfer required approval from centralized systems that controlled how money moved across the internet. Bitcoin introduced a new model that bypassed traditional banks and enabled people to send money directly through a decentralized network. No single company owned the system, and no government controlled its supply.
Over time, Bitcoin grew from a digital payment experiment into a global financial asset. In fact, the firstborn coin often sets the direction for the entire crypto industry. As such, understanding Bitcoin involves tracking price movements, as well as other macro and on-chain data that shape its behavior. This guide examines its operational principles and how the Bitcoin ecosystem grew into a global financial network.
The Creation of Bitcoin and the Evolution of Digital Money
Digital payments existed long before Bitcoin appeared. Credit cards, bank transfers, and online payment platforms already allow people to move money online. However, those systems relied almost entirely on centralized frameworks and controls. Banks and payment processors acted as intermediaries between buyers and sellers. Every transaction required approval from institutions that controlled the movement of funds. While such an arrangement offered convenience, it also came with several weaknesses. Payments could be blocked or frozen, and international transfers are often slow and expensive.
Concerns around financial control became even stronger during the global financial crisis of 2008. At the time, major banks collapsed, which made governments implement large bailouts, weakening the trust in traditional finance sharply. It was at this time that interest in decentralized financial systems began to grow among programmers and cryptographers. As expected, this concentrated interest in Bitcoin emerged from that environment.
The Problem Bitcoin Was Trying to Solve
Traditional digital money systems struggled with trust, as users had to rely on financial institutions to store cash and process transactions. On top of that, governments also controlled financial activity through central banks. As many would expect, this model created several challenges. Banks could freeze funds or even restrict accounts in some instances. In extreme cases, they even declined banking services altogether while maintaining the authority to approve or reject transactions.
Moreover, the system created single points of failure, as operational disruptions could temporarily prevent millions of users from accessing their money. Bitcoin was designed to address many of these limitations by allowing users to transfer and store value without relying on a central authority to control access, approve transactions, or manage the system. Inflation also reduced purchasing power over time as governments expanded the money supply. Bitcoin introduced a system that allowed users to hold and transfer value directly, thereby bypassing centralized intermediaries.
Another major issue with older forms of digital currency is double spending. Before Bitcoin arrived on the scene, digital assets were easily copied. This meant that there was no reliable way to prevent duplicate transactions without verification from a central authority. Bitcoin solved that problem by recording transactions on a public blockchain maintained collectively by network participants.
Who Is Satoshi Nakamoto?
Satoshi Nakamoto is the elusive creator of Bitcoin who has maintained their anonymity until now. Those within the crypto cycle have pitched different tents regarding the identity of Bitcoin’s creator. While some believe the identity belongs to a person, others say it’s a group pseudonym. Nakamoto published a white paper titled “Bitcoin: A Peer-to-Peer Electronic Cash System” in October 2008. In the document, Satoshi explained how decentralized networks could process transactions. A few months later, Nakamoto released Bitcoin’s software and launched the network the following year.
According to reports, Nakamoto communicated with early developers via forums and email during Bitcoin’s early years. Around 2010, their activity slowly disappeared from public view. Since then, many theories have been floated to identify Bitcoin’s creator, but none have been proven. Bitcoin’s survival without its founder became one of its strongest features. The network continued to operate normally even after Nakamoto disappeared.
The Bitcoin Whitepaper
Bitcoin’s whitepaper remains one of the most important documents in cryptocurrency history. The paper introduced several concepts that became the foundation of the firstborn coin. Inside the paper was the framework for peer-to-peer transactions, proof-of-work mining and decentralized verification. It also covers the principle of fixed monetary supply, which helped to create a system for transferring value without a central authority.
Earlier digital currency projects relied too heavily on centralized control, which caused them to fail. But Bitcoin overcame many of these limitations by combining existing cryptographic tech with an incentive structure. With this reward-based system, miners helped validate transactions and add new blocks to the blockchain. By doing so, they received newly issued Bitcoin as block rewards, along with transaction fees paid by users. This incentive system helped secure the network while supporting its decentralized nature.
The Genesis Block and Early Adoption
Bitcoin’s first block, known as the Genesis Block, was created on January 3, 2009. Within the block, Nakamoto dropped a message referencing a newspaper headline about bank bailouts. The message was titled “The Times 03/Jan/2009 Chancellor on brink of second bailout for banks.” Many viewed the message as a criticism of traditional financial systems and centralized monetary policy.
Bitcoin initially held little monetary value when it first hit the scene. In fact, early users were primarily just programmers, cryptographers, and members of the cypherpunk community. Most people even viewed Bitcoin as an experiment rather than a future global asset.
One of the OG crypto’s most famous early transactions happened in 2010 when programmer Laszlo Hanyecz paid 10,000 BTC for two pizzas. Interestingly, the transaction became symbolic years later, as the coin’s value reached hundreds of millions of dollars. Following its early years of slow adoption, Bitcoin gradually attracted attention because of its decentralized structure and limited supply.
Previous Attempts at Digital Currency Before Bitcoin
Bitcoin was not the first attempt at creating digital money. Before the OG crypto, several projects appeared years earlier with the sole purpose of creating digital currencies independent of traditional banking systems. Many of those systems introduced important ideas that later influenced cryptocurrencies. Some experimented with anonymous payments, while others focused on cryptographic verification or decentralized transaction systems. Still, most failed due to over-reliance on centralized infrastructure.
DigiCash and Centralized Failure

David Chaum launched DigiCash in the late 1980s and early 1990s, which provided electronic payments using cryptographic technology. With this system, users could send digital money without publicly exposing personal information. It also introduced several important concepts, such as digital signatures and anonymous payments.
But like traditional banks, DigiCash depended on centralized operations. This meant users had to trust the company to manage the system honestly. That dependency became a major weakness that stalled the progress of the project. Moreover, merchants hesitated to adopt the technology because there were too few users. Meanwhile, users saw little reason to join without merchant support. Even though DigiCash eventually folded in 1998, many of its ideas later influenced the development of crypto.
Hashcash and Proof-of-Work Origins
Proof-of-Work (PoW) is a consensus system that requires participants to perform a computational task on a computer to verify a block. Cynthia Dwork and Moni Naor first introduced the idea in 1993 to reduce spam and other forms of network abuse.

In 1997, Adam Back expanded on their work and created Hashcash. The security tool later became an important influence on Bitcoin’s PoW system, aiming to reduce spam emails and online attacks.
Years later, Bitcoin used the same concept in its mining system. Miners compete to validate transaction blocks and secure the network using computational power. Hashcash demonstrated that requiring computational effort could make digital actions costly, introducing a form of scarcity that later became central to Bitcoin’s design.
Bit Gold and B-Money Concepts
Several digital currency proposals during the late 1990s adopted Bitcoin’s concept of potential decentralization. In an attempt to create a decentralized virtual currency, computer scientist Nick Szabo proposed Bit Gold in 1998. Many of the system’s concepts closely resembled those of Bitcoin.

At the same time, Wei Dai introduced another proposal for a decentralized currency. Called B-money, the idea outlined a system in which users collectively maintained transaction records and verified transfers without a central authority. Many features from Bit Gold and B-money later appeared in Bitcoin’s architecture, including distributed consensus and cryptographic transaction verification. However, neither project fully solved the technical challenges required to create a working decentralized currency. Even so, these frameworks became the underpinning driver of the Bitcoin network.
Why Earlier Digital Currency Systems Failed
Early digital currency projects failed due to reliance on central companies or operators. This created a single point of control, causing the assets to fail under government pressure and regulatory scrutiny. Moreover, many of these projects also struggled with technical challenges such as double spending and network consensus.
However, Bitcoin overcame these challenges by combining cryptography, PoW and distributed verification. It also introduced a fixed-supply model, which increased the system’s value proposition. As such, the network became the first successful decentralized digital currency by solving several problems simultaneously. Bitcoin stood out by showing that a digital currency could function without a central authority.
The Byzantine Generals’ Problem
Bitcoin’s biggest breakthrough was solving a long-standing computer science problem known as the Byzantine Generals Problem. In simple words, the problem describes how distributed participants can agree on shared information even when some participants may act dishonestly.
A common example involves several generals surrounding a city, with each having to decide whether to attack or retreat. In that instance, some may intentionally spread misleading information. The challenge is finding a way for the group to reach a reliable decision even when bad actors are involved. Distributed computer networks face similar problems as participants need a way to agree on valid transactions in a decentralized system.
Bitcoin solved this issue by using proof-of-work mining and decentralized consensus, in which miners compete to validate blocks of transactions. As a reward, they receive BTC for securing the network. In addition, the network then accepts the longest valid blockchain as the shared version of truth. This system allows thousands of independent nodes worldwide to stay in agreement without needing a central controller.
Trustless Verification and Consensus
Most traditional financial systems depend heavily on trust to verify transactions and keep records accurate. Bitcoin introduced a different approach called trustless verification. The network uses cryptography and shared rules to automatically verify transactions.
BTC transactions are broadcast and verified by thousands of independent nodes, which verify details such as digital signatures and wallet balances. Miners then add these transactions into blocks, which are added to the blockchain as an immutable record. Within this system, every participant follows the same protocol to reach consensus without a central authority.
Why Bitcoin’s Design Was Different
Bitcoin combined several features that earlier digital currency systems failed to connect successfully. Fixed supply became one major difference, with Bitcoin’s total supply capped at 21 million coins. Unlike fiat currencies, supply cannot expand freely through central bank decisions. Bitcoin also removed the need for a central authority to verify transactions.
Since thousands of nodes maintain the blockchain independently, no central server controls transaction approval. PoW mining also added another layer of security to the technology. Launching an attack on the Bitcoin network requires massive computational resources, resulting in excessive energy costs, which makes manipulation extremely expensive.
Another important feature was open participation. Anyone with internet access could join the network without requiring approval from any central authority, bank or financial institution. Public blockchain transparency became another major innovation, allowing anyone to check transactions on the network using block explorers or other dedicated tools.
What Is Bitcoin and Why Does It Matter?
Bitcoin is a decentralized digital currency that can be used to send and receive value over a peer-to-peer network. Given its on-chain nature, the asset is recorded on a digital distributed ledger called the blockchain. Since Bitcoin operates globally, users can transfer funds across borders without relying on banks or payment processors.
Bitcoin is a peer-to-peer electronic cash and settlement network with predictable issuance. BTC is the native asset that secures the chain. Markets often describe Bitcoin as scarce settlement money, but its censorship resistance comes from decentralized validation, not branding or corporate sponsorship.
Large holders may spread reserves across multiple addresses for operational resilience and long-term threat planning, including concerns about future cryptographic risks. Distributing coins across addresses is a treasury and custody practice, not a change to Bitcoin’s monetary rules. Readers should therefore distinguish reserve-management decisions from actual protocol upgrades.
The lack of centralized oversight also means users can conduct transactions at any time. Interestingly, the asset has moved beyond its early days of functioning as a simple payment system. Today, many investors view it as a long-term financial asset and a hedge against inflation or currency debasement.
Bitcoin as a Decentralized Network
While traditional financial systems depend on centralized databases controlled by banks and governments, Bitcoin works differently. Thousands of computers called nodes maintain identical copies of Bitcoin’s blockchain worldwide. In this kind of system, no single entity controls transaction records or monetary policy in its entirety.
In addition, the network remains resistant to censorship because no central operator can easily block transactions globally. The system also becomes harder to shut down since each participating node on the network carries a copy of the blockchain, spread across many countries and jurisdictions. Even if some of these nodes fail or disconnect, Bitcoin continues operating normally because other nodes maintain the network. As many would admit, that structure became one of Bitcoin’s strongest innovations.
Bitcoin’s Fixed Supply and Scarcity
Bitcoin introduced digital scarcity for the first time successfully with a capped supply of 21 million BTC. Unlike fiat currencies, new Bitcoin cannot be printed freely through monetary expansion policies. New coins enter circulation through mining rewards. Approximately every four years, Bitcoin undergoes a halving event that reduces new supply issuance by half.
Bitcoin’s predictable monetary policy became one reason many investors compare it to gold.
Supporters often refer to Bitcoin as “digital gold” because:
- supply remains limited
- issuance slows over time
- inflation rate decreases gradually
Even though scarcity alone does not automatically create value, its predictable supply gives Bitcoin a monetary structure very different from that of traditional currencies.
Bitcoin as Digital Money
Bitcoin, as a digital currency, looks into three core functions of money in economics. It serves as a medium of exchange, a store of value and a unit of account. As a medium of exchange, Bitcoin allows users to transfer value without relying on banks or other intermediaries. This enables peer-to-peer transactions across borders and provides an alternative payment network outside traditional financial institutions.
With its capped supply of 21 million coins, Bitcoin serves as a store of value. Basically, many holders view Bitcoin as a way to preserve purchasing power over time, which is similar to gold and other scarce assets. And as a unit of account, BTC can be used to quote prices and settle transactions within its own network.
Blockchain Technology and How It Works
Blockchain technology powers Bitcoin’s entire network and lets it maintain decentralized transaction records securely. In the crypto ecosystem, a blockchain serves as a public digital ledger that stores transaction history in chronological order. Every confirmed transaction becomes part of a permanent record shared across the network. Unlike centralized databases controlled by one entity, blockchain records are maintained collectively by thousands of independent nodes operated by network participants.
What Is a Blockchain?
A blockchain is a digital chain of blocks that stores transaction data, such as records, timestamps and cryptographic references. These blocks are linked together in sequence using cryptographic hashes, which create a permanent and secure record of transactions.
Every new block connects to the previous one, forming a continuous transaction history. And the hash of a block changes if someone tries to alter an earlier record. This breaks the connection with all subsequent blocks, causing their hashes to change as well.
To successfully modify the record, an attacker would need to recalculate and replace every affected block across the network. But this requires enormous computing power and is extremely difficult on Bitcoin’s large, decentralized network. Bitcoin’s blockchain is also public, allowing anyone to view transaction history through block explorers.
Components of a Blockchain
Several components work together inside Bitcoin’s blockchain system. The transactions recorded on the blockchain represent transfers of Bitcoin ownership between addresses. Miners, operating Bitcoin nodes verify the transactions and add them into the next available block, that becomes part of the blockchain. Each of these nodes maintain a copy of the blockchain and independantly verify network rules. The transactions are deemed confirmed only when majority of the nodes verifying the records reach a consensus about its authenticity and compliance with applicable rules. Miners compete to validate new blocks using computational work. Cryptographic hashing secures blockchain records. Bitcoin uses SHA-256 hashing extensively throughout its mining and verification process.
How Blocks Are Added to the Chain
Whenever Bitcoin transactions are executed, they enter a waiting area called the mempool as pending transactions for miners to pick them up. These transactions are then grouped by the miners into a candidate block. The mining machines repeatedly perform hashing calculations on the candidate block while changing a value called a nonce.
The goal is to produce a block hash that meets Bitcoin’s current network difficulty target. A hash is considered valid when it falls below this target, which proves that the miner has performed the required computational work.
When a miner discovers a valid hash, the completed block is broadcast to other nodes across the network. These nodes independently verify the block via transaction validity and digital signatures. Even more, it checks for PoW compliance and consistency with the existing blockchain. Nodes then add a verified block to their copy of the blockchain. The newly accepted block becomes the latest block in the chain and serves as the foundation for future blocks.
Why Blockchain Is Secure
Bitcoin’s decentralized nature is a core fundamental of its security architecture and makes it highly resistant to manipulation. Within its system, thousands of computers maintain copies of the blockchain and work together as validators.
An attacker would need to gain control of a majority of the network’s computing power to change Bitcoin’s transaction history. And in reality, this is extremely difficult and expensive.
The blockchain itself is protected through cryptographic hashing, which changes when tampered with. Bitcoin’s security model is built on the PoW system, where miners compete to solve complex mathematical problems using computing power. In turn, these miners receive BTC as a reward. Because creating blocks requires substantial hardware and energy costs, launching attacks against the network becomes extremely expensive.
For example, an attacker attempting to rewrite transaction history or perform a double-spend attack would need to control enormous amounts of computing power while competing against the rest of the global mining network. At the same time, miners have a strong financial incentive to follow the rules because honest participation earns rewards, while attacking the network risks significant costs with little guarantee of success.
How Bitcoin Transactions Work
Bitcoin transactions may appear simple from a user’s perspective, but several processes occur behind the scenes before transfers become fully confirmed. Every transaction moves Bitcoin ownership from one address to another through cryptographic verification and decentralized validation. Unlike bank transfers, Bitcoin transactions do not pass through centralized clearing systems.
Creating a Bitcoin Transaction
Bitcoin allows users to carry out decentralized financial transactions. Behind the scenes, there are key elements that make up a successful transaction. Wallet software plays a key role by creating and authorizing transactions. Once submitted, network participants check each transaction before adding it to the blockchain.
Every Bitcoin transaction begins with a wallet that generates two cryptographic keys. A public key helps create wallet addresses used for receiving funds, while a private key remains secret and authorizes transactions out of these wallets.
The wallet software creates a transaction message in order to send Bitcoin. This message contains key information, such as the recipient’s address and transaction details. Next, the wallet signs the transaction with the sender’s private key. Then, digital signatures confirm ownership of the funds without exposing sensitive information. Once signed, the transaction is broadcast to the Bitcoin network for verification and storage.
Transaction Verification Process
Once a Bitcoin transaction is broadcast to the network, nodes independently verify it before accepting. For context, these nodes are simply on the Bitcoin network that help with rule enforcement. And these nodes help prevent fraud, errors and double spending, thus allowing only valid transactions to be recorded.
Transactions that pass verification immediately enter the mempool. Often, miners prioritize transactions with higher fees because those fees are part of their mining rewards. And as such, users who attach larger fees often receive faster confirmations whenever there’s heavy network activity. Once miners include the transaction in a block and the block becomes part of the blockchain, the transaction receives its first confirmation and becomes increasingly secure as additional blocks are added.
Mempool and Confirmation Times
The mempool is where Bitcoin transactions line up for confirmation. Generally, nodes keep copies of these waiting transactions for miners to choose from. Bitcoin is designed to create a new block about every 10 minutes on average, and to keep this rate steady, the network adjusts mining difficulty with respect to computing power requirements.
Even so, blocks are not created exactly every 10 minutes, with some found either side of the time. Because of this, the time it takes for a transaction to be confirmed can vary. Even at that, Bitcoin averages about one new block every 10 minutes over the long run.
The speed of a transaction usually depends on network congestion, fees and available block space. When many users are sending Bitcoin at the same time, the mempool can become crowded. And as such, this can create a backlog of pending transactions. During these periods, users often increase transaction fees to encourage miners to prioritize their transactions since miners generally prefer transactions that offer higher fees.
This dynamic becomes especially visible during periods of heavy network activity. Average Bitcoin transaction fees briefly climbed to around $59 in April 2021 as congestion increased and users competed for limited block space. Transactions carrying lower fees may remain in the mempool for several blocks before eventually being confirmed.
The mempool is gradually cleared as miners add new blocks to the blockchain and confirm pending transactions. However, transactions are generally selected only when they meet the fee levels miners are willing to accept at that time. Most exchanges and merchants also wait for multiple confirmations before considering a transaction fully settled. Each additional block added after a transaction increases security and further reduces the likelihood that the transaction will be reversed.
Bitcoin Transaction Fees
Bitcoin transaction fees do not depend directly on the transfer amount. Instead, fees depend mostly on transaction size, measured in data bytes. Users attach fees voluntarily to encourage miners to prioritize their transactions. During busy market periods, fees can rise sharply because many users compete for limited block space simultaneously. Fees also play an important long-term role in Bitcoin’s economy as mining rewards generally decrease through halving events. Thus, transaction fees are increasingly important to miners’ revenue.
How Bitcoin Price Discovery Works
Bitcoin’s price is dictated by market forces. It’s price changes constantly as buyers and sellers trade across exchanges around the world. This process is called price discovery, in which the market continuously determines what Bitcoin is worth in real time. The price is influenced by activity from regular traders, large institutions, ETF markets, and derivative platforms such as futures trading. Supply and demand play a major role, but other factors also affect price movements, including liquidity, leverage, macroeconomic news, and overall market sentiment.
A simple way to think about it is like an auction. If more people want to buy Bitcoin than sell it, the price usually rises. If fear spreads and more people rush to sell, the price tends to fall. News about interest rates, inflation, regulations, or large institutional purchases can quickly change how traders react and push prices higher or lower. Because Bitcoin trades globally 24/7, price discovery never stops. The market constantly adjusts as new information, trading activity, and investor behavior enter the system.
Spot Demand and Supply
The spot market is where Bitcoin is bought and sold directly. When an investor purchases Bitcoin on an exchange and takes ownership of the actual BTC, the transaction takes place in the spot market.
Bitcoin’s price generally rises when demand becomes stronger than available supply and falls when selling pressure outweighs buying activity. Several factors can increase spot demand, including institutional accumulation, growing retail investor participation, ETF inflows, favorable macroeconomic conditions, and long-term investor confidence.
Supply conditions are equally important, as a significant portion of Bitcoin remains inactive in long-term wallets for years. And this effectively reduces the amount of BTC available for active trading. Because Bitcoin has a fixed maximum supply of 21 million coins, a limited circulating supply can lead to stronger price movements when demand suddenly increases.
Spot Bitcoin ETFs have also changed the market structure significantly. When investors allocate capital into spot Bitcoin ETFs, issuers typically need to purchase real Bitcoin to back those investments. During periods of strong ETF inflows, this can create steady buying pressure and tighten available supply across the market.
Derivatives and Leverage
Derivative markets play a major role in Bitcoin price movements today. Futures and perpetual contracts allow traders to speculate on Bitcoin’s price without directly owning BTC. Many traders also use leverage, which means borrowing capital to increase the size of their positions. Leverage can amplify profits when the market moves in a trader’s favor. However, it can also magnify losses when prices move in the opposite direction.
Funding rates are periodic payments exchanged between long and short traders in perpetual futures markets. They help keep perpetual contract prices aligned with the spot market. A positive funding rate means long traders are paying short traders, which often indicates that bullish positions are more crowded. In contrast, a negative funding rate means short traders are paying long traders, which often reflects stronger bearish sentiment.
Open interest measures the total value of futures contracts that remain active and have not yet been closed. It helps show how much capital is currently committed to the derivatives market. When open interest rises alongside Bitcoin’s price, it often suggests that new money and additional speculative positions are entering the market. However, rising open interest alone does not indicate whether traders are bullish or bearish.
High levels of leverage can sometimes create unstable market conditions. When prices move sharply, heavily leveraged traders may be forced to close their positions through automatic liquidations. These liquidations can trigger additional buying or selling pressure, causing Bitcoin’s price to move even more rapidly. As a result, periods of high leverage are often associated with increased volatility.
Liquidity and Slippage
Liquidity refers to how easily Bitcoin can be bought or sold without causing large price changes. When liquidity is strong, there are plenty of buyers and sellers in the market, which usually helps keep prices more stable. When liquidity is weak, even relatively small trades can trigger sharp price movements. Exchanges use order books that contain buy and sell orders at different price levels. A highly liquid market has large volumes of orders spread across many price ranges, allowing trades to occur smoothly with minimal price disruption.
Slippage occurs when a trade is executed at a price different from the expected price because there is insufficient liquidity at the desired level. For example, a trader may try to buy Bitcoin at one price, but if there aren’t enough sellers, the order moves up the order book and gets filled at the next best available prices.
Low liquidity conditions often occur on weekends, during overnight trading hours, amid major news events, or during periods of panic selling. During these times, Bitcoin can become far more volatile because fewer orders are available to absorb large buying or selling pressure.
Bitcoin Liquidity and Volatility Regimes
Bitcoin moves through different market cycles over time, with some periods characterized by slow and calm price movements. Some other times, the asset experiences intense volatility and rapid swings in both directions. Unlike traditional financial markets that operate during fixed trading hours, Bitcoin trades continuously across global exchanges, allowing sentiment, liquidity, and speculation to influence price action at any moment.
Liquidity conditions often play a major role in shaping these market environments. When liquidity is strong and large amounts of capital are available on both the buy and sell sides, price movements tend to be smoother and more stable.
However, when liquidity becomes thinner, even relatively small waves of buying or selling pressure can trigger outsized price swings. Interestingly, this trend is one reason Bitcoin historically experienced far greater volatility than traditional assets, especially during its early years, when market depth was relatively limited.
Historically, BTC has largely traded with extreme volatility. The asset traded for less than $0.001 in 2009 before climbing to roughly $0.30 by the end of 2010, representing a gain of nearly 9,900% within a single year.
At the same time, Bitcoin also experienced repeated collapses exceeding 50% during major bear markets. One of the most severe declines occurred after the 2011 Mt. Gox exchange crisis, when BTC crashed from around $31 to nearly $2, wiping out more than 90% of its value within months. Bitcoin’s volatility has slowly changed as the market has grown larger and more mature. Early Bitcoin markets experienced far more violent price swings because fewer people traded the asset and liquidity remained relatively weak.
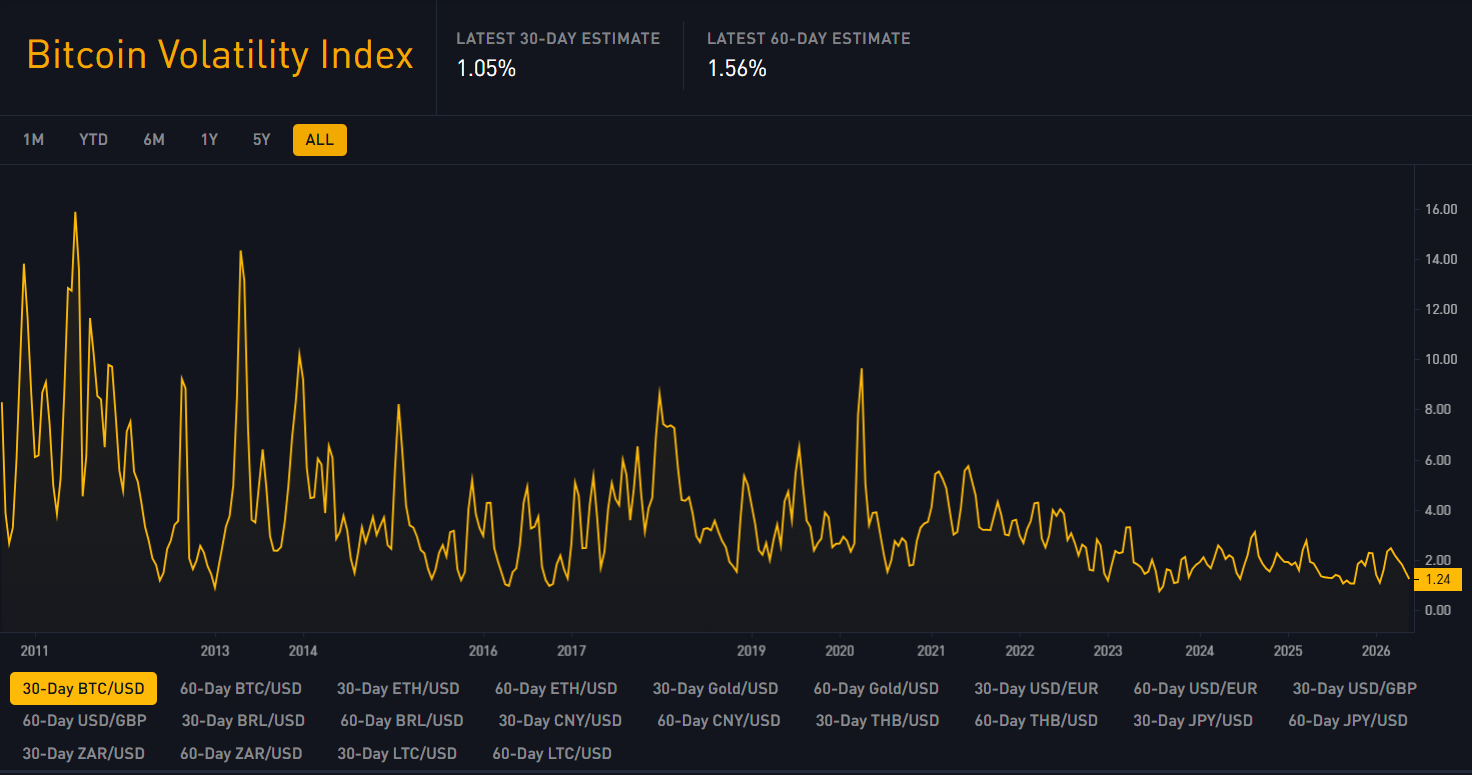
Image Source: BitBO
Today, institutional investors, Bitcoin ETFs, and deeper global trading activity help create more stability than before. Data from the Bitcoin Volatility Index reflects this shift, showing that volatility has generally declined compared to Bitcoin’s earlier years.
Still, volatility never fully disappears from Bitcoin markets. History shows that long quiet periods often precede large price movements. Major news events, liquidity shocks, or sudden buying and selling pressure can quickly push volatility higher again.
Volatility Compression and Quiet Market Phases
Compression regimes occur when Bitcoin trades within a relatively narrow price range for an extended period. During these phases, volatility declines because buyers and sellers remain temporarily balanced. Price action often appears slow, quiet, and directionless, leading many traders to assume the market has become inactive.
However, these periods frequently emerge after major rallies, sharp corrections, liquidation cascades, or broader macroeconomic uncertainty. Following strong market moves, traders often become more cautious, reducing speculative activity and causing Bitcoin to consolidate within tighter ranges.
Historically, Bitcoin has repeatedly entered prolonged consolidation phases before major breakouts. After the sharp COVID crash in March 2020, for example, BTC spent months stabilizing before beginning the powerful bull market that eventually pushed prices above $60,000 in 2021. Similar compression structures also appeared before earlier bull runs in 2013 and 2017.
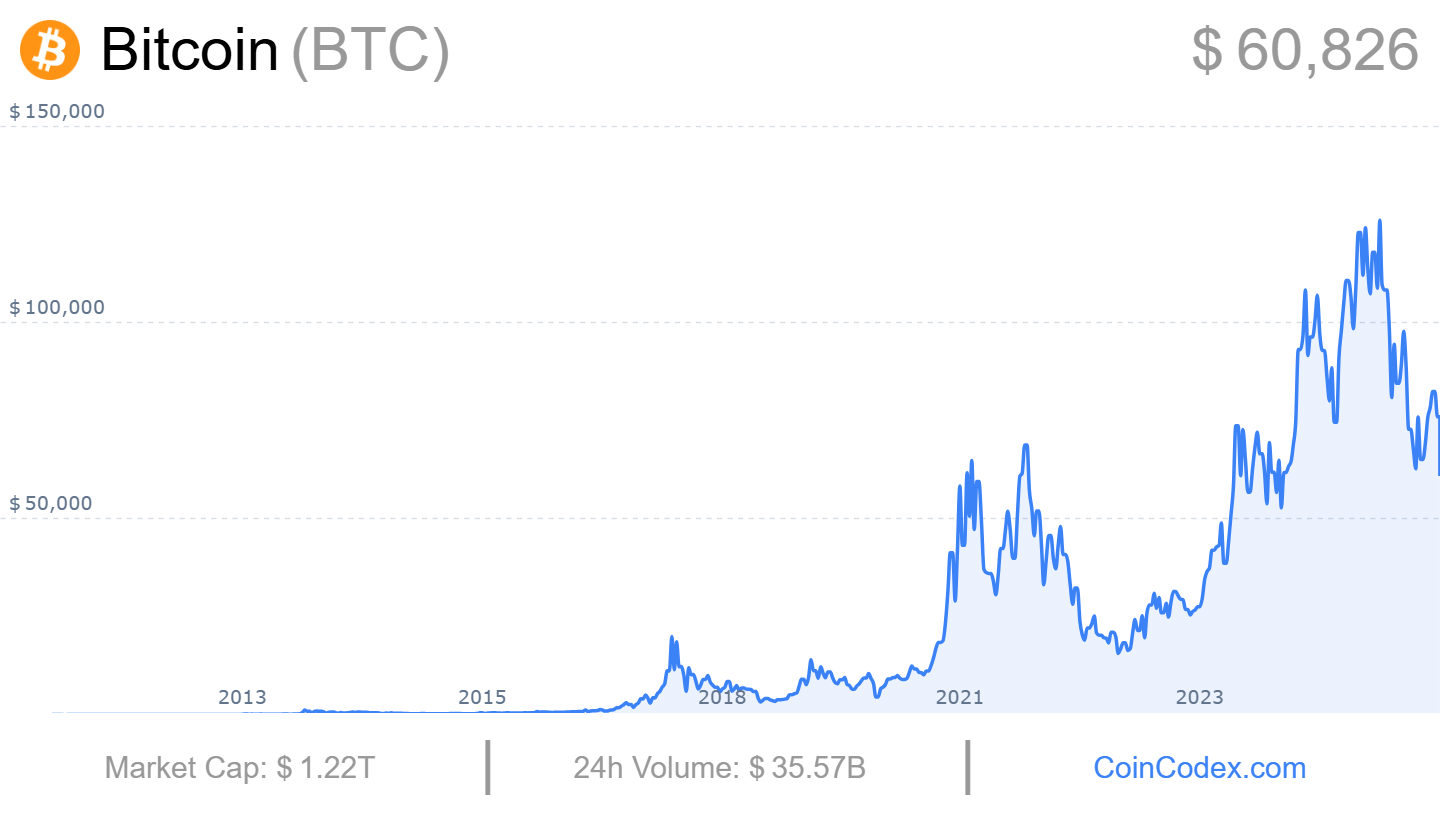
Image Source: CoinCodex
These quiet periods are important because volatility contraction often stores what traders describe as “market energy.” As trading ranges tighten and volatility declines, leveraged positioning and liquidity can begin clustering around key price levels. Once Bitcoin finally breaks outside those ranges, momentum can accelerate rapidly.
This pattern is visible in the Bitcoin Volatility Index image above. Earlier market cycles showed extremely violent volatility spikes, particularly during Bitcoin’s early adoption years. Over time, the index gradually trended lower as the market matured, though occasional spikes still appeared during major macroeconomic events, panic sell-offs, and speculative rallies. The latest estimates near the right side of the chart show volatility sitting far below historical extremes, reinforcing how Bitcoin periodically shifts between low-volatility compression and explosive expansion phases.
Expansion Regimes and Momentum-Driven Markets
Expansion phases happen when Bitcoin breaks out of its previous trading range and starts making large price moves. During these periods, volatility increases and prices can rise or fall much faster than usual. Trading activity also tends to grow as more traders enter the market. Strong spot buying, ETF inflows, positive sentiment and leveraged trading commonly help drive prices up. In many cases, prices rise as more people become interested in buying, creating a feedback loop where rising prices generate even more demand.
Bitcoin’s past bull markets show how powerful these expansion phases can be. During the 2013 bull run, the asset gained about 730% between May and December. Growing media coverage and wider adoption helped attract new buyers and increase demand. Furthermore, the 2017 bull market continued to strengthen. The BTC price rose from about $1,000 to nearly $20,000 in one year. Much of this growth was driven by excitement over the asset’s Initial Coin Offering (ICO) boom. As more people rushed to invest, demand increased, and prices rose rapidly.
Daily trading volume also increased sharply from under $200 million to more than $15 billion by the end of the cycle. This showed that more money and more participants were entering the market as prices continued to rise.
The 2020-2021 cycle introduced a different type of expansion regime driven heavily by institutional participation. Public companies such as MicroStrategy and Tesla added Bitcoin to their corporate balance sheets, while institutional inflows exceeded billions of dollars. At the same time, concerns surrounding inflation and aggressive monetary stimulus strengthened Bitcoin’s “digital gold” narrative.
The current 2024-2025 cycle introduced another major structural shift through the approval of U.S. spot Bitcoin ETFs. By late 2024, spot ETF inflows had exceeded tens of billions of dollars, while institutional demand significantly reduced available exchange supply. Bitcoin subsequently reached new all-time highs above $90,000 as ETF participation, halving expectations, and renewed institutional accumulation combined to create another strong expansion environment.
Bear markets can also create aggressive expansion phases on the downside. Forced selling, panic, and liquidations can accelerate declines extremely quickly, especially when leverage becomes excessive. The March 2020 COVID crash demonstrated this clearly when Bitcoin lost roughly 50% of its value within a single day during one of the largest liquidation cascades in crypto history.
Exhaustion Phases and Market Reversals
Strong market trends eventually begin losing momentum, mostly after long periods of rising or falling prices. And this often causes Bitcoin to enter an exhaustion phase where its strength fades. During bullish exhaustion phases, buyers may become less aggressive as profit-taking increases and new demand slows. In bearish exhaustion periods, sellers can gradually lose control as panic subsides and long-term investors begin re-entering the .
These transitions are not always immediately obvious. Markets may continue moving in the same direction for some time even as underlying conditions begin deteriorating beneath the surface. Trading volume may weaken, volatility may slowly contract, and speculative activity across derivatives markets may begin to fade.
Historically, Bitcoin’s major bull runs repeatedly transitioned into sharp corrections after periods of euphoric sentiment and aggressive speculation. The 2017 cycle eventually collapsed into an 84% bear market after retail-driven momentum reached unsustainable levels. Likewise, the 2021 cycle experienced repeated corrections as leverage, macroeconomic tightening, and regulatory uncertainty began pressuring the market.
At the same time, exhaustion phases can also create the foundation for future recoveries. Fear-driven markets often stabilize once sellers become depleted and confidence gradually returns. Bitcoin’s history repeatedly shows that severe drawdowns eventually gave way to new accumulation phases and later expansion cycles.
Liquidation Cascades and Liquidity Sweeps
Leverage plays a major role in Bitcoin’s price movements. Many traders borrow funds to enlarge positions and potentially earn larger profits. While this can amplify gains, it also increases the risk of losses. When Bitcoin’s price moves sharply, some leveraged positions can no longer meet exchange requirements. These positions are automatically closed in a process known as liquidation.
If the market drops quickly, traders who were expecting higher prices may be forced to sell. This additional selling can push prices even lower. Conversely, if the market rallies quickly, traders who had bet against Bitcoin may be forced to buy back their positions, driving prices even higher.
Liquidity sweeps occur when Bitcoin rapidly moves through areas with high concentration of stop-loss orders or heavily leveraged positions. Once those levels break, exchanges automatically close positions that no longer meet margin requirements.
Such forced liquidations can sometimes trigger a spike in price movement. Long liquidations happen when bullish traders are forced out during sharp declines, while short liquidations occur when bearish traders get squeezed during aggressive rallies. This chain reaction explains why Bitcoin tends to trade faster and more violently than traditional financial markets. In heavily leveraged conditions, liquidations themselves can become the primary driver of short-term price action.
These liquidations cascaded, amplifying multiple high-profile Bitcoin crashes and rallies. In the March 2020 crash, billions of dollars in leveraged positions were eliminated within hours as forced selling quickly amplified downside momentum. Similar liquidation squeezes have left a recurring legacy on sharp bull runs, as short sellers had to cover in advance.
Over the years, these repeated cycles of compression, expansion, exhaustion, and liquidation have become one of Bitcoin’s defining market dynamics. While volatility remains one of the most significant risks of the asset, it is also one of the key drivers for traders, institutions, and long-term investors in the race for asymmetric returns.
Bitcoin Mining, Hashrate, Difficulty, and Supply Mechanics
Bitcoin mining secures the network, validates transactions, and introduces new BTC into circulation. Instead of relying on a central authority, Bitcoin distributes transaction verification across a global network of miners competing through computational work.
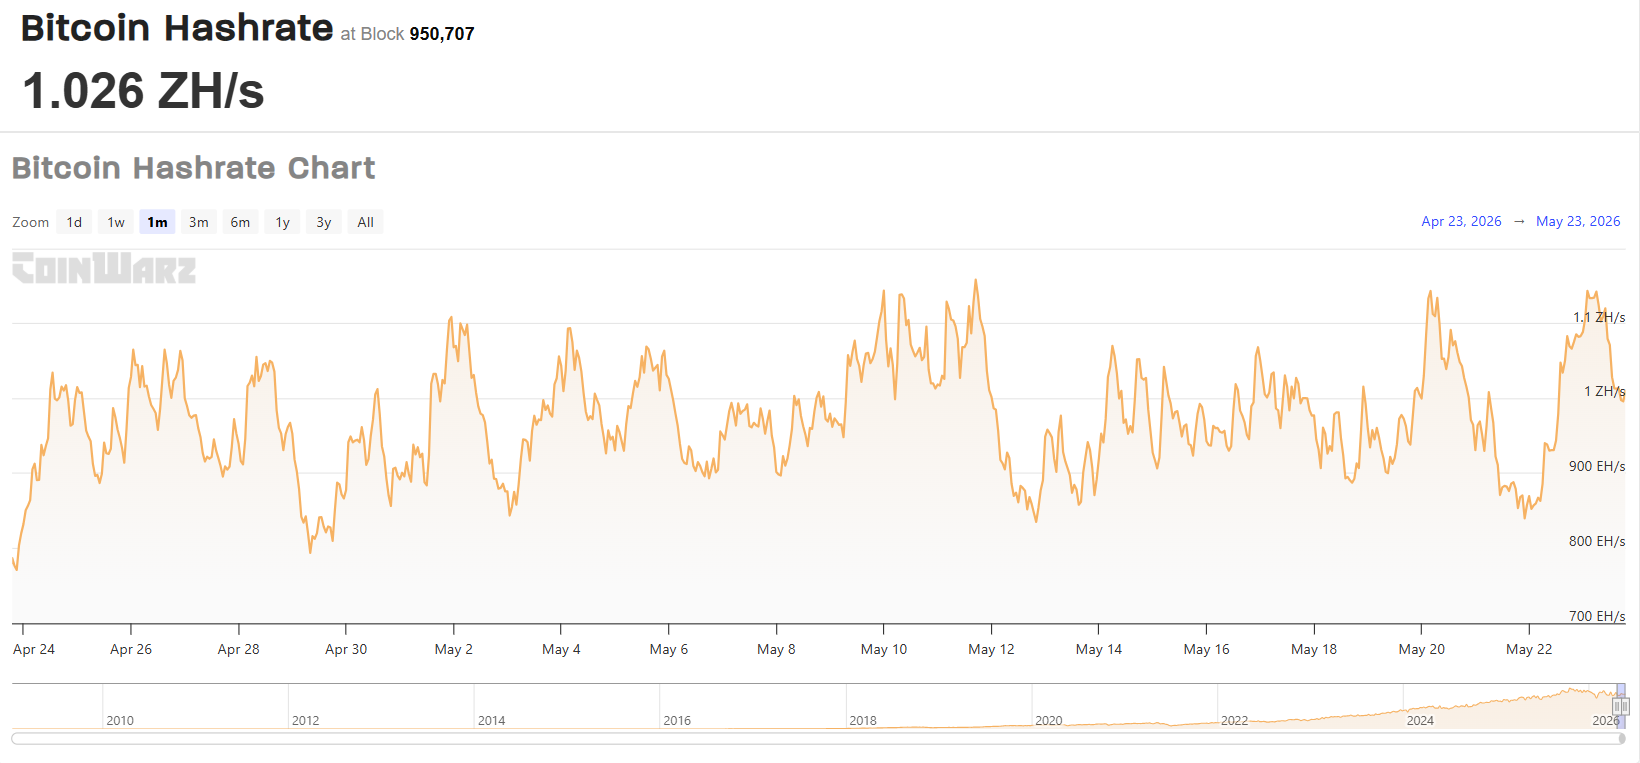
Since Bitcoin launched in 2009, mining has evolved from hobbyists using home computers into a global industry powered by specialized ASIC hardware and large-scale facilities. This growth is reflected in Bitcoin’s network hashrate, which now exceeds 1 Zetahash per second (ZH/s), showing how much computational power is actively securing the blockchain.
Mining difficulty has also climbed to roughly 136.61 trillion, highlighting how competitive Bitcoin mining has become over time. Mining difficulty measures how hard it is for miners to successfully discover a validblock compared to Bitcoin’s earliest days. As more miners join the network and contribute computational power, Bitcoin automatically raises difficulty to maintain stable block production.
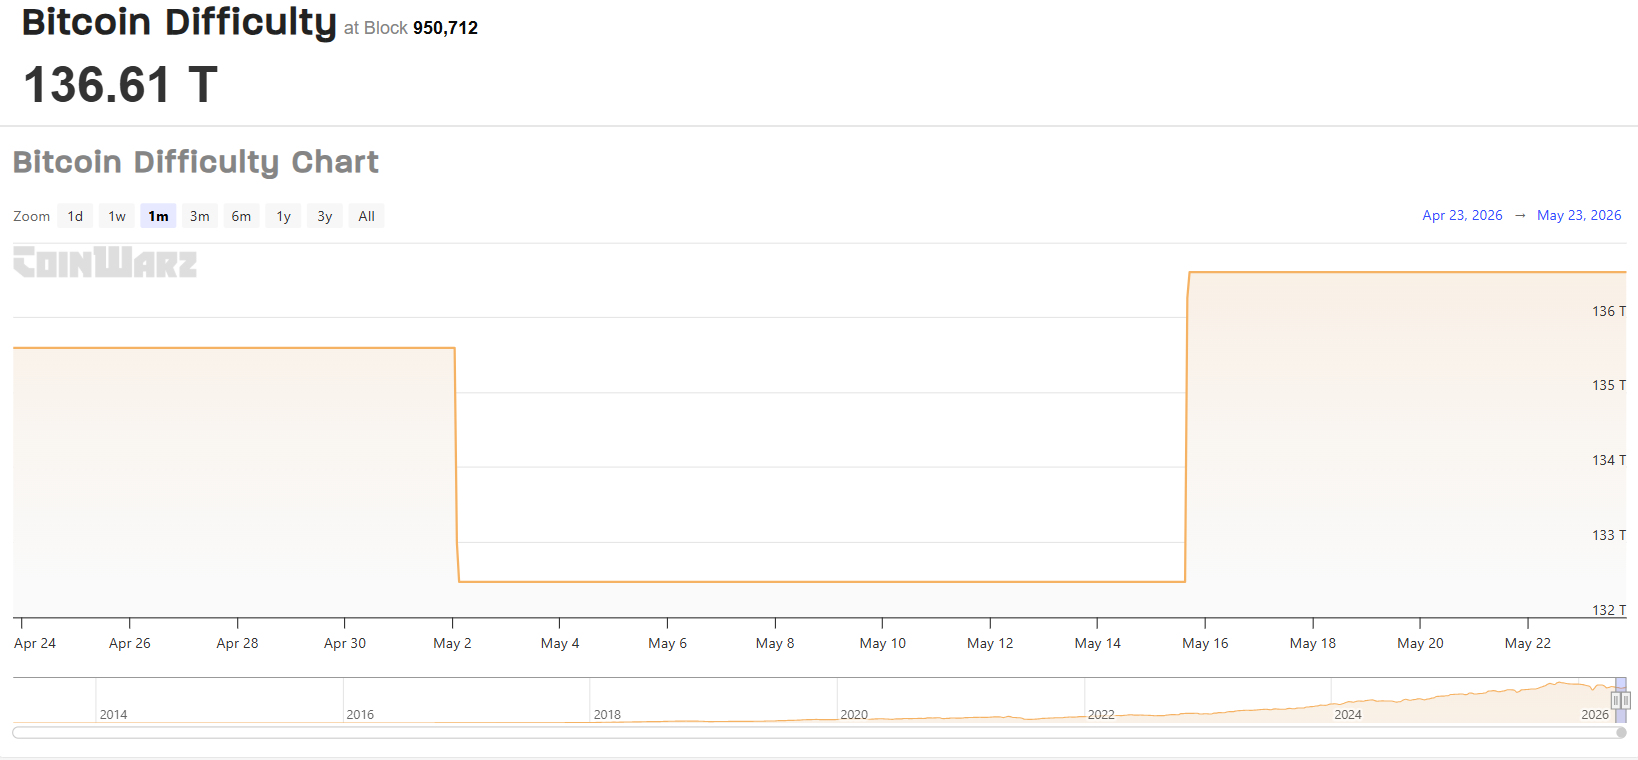
Miners continuously generate SHA-256 hashes in an attempt to produce a valid block hash below Bitcoin’s target threshold. Because hash outputs are unpredictable, miners may need to perform trillions upon trillions of hashing attempts before successfully finding a valid solution. The current difficulty level of roughly 136.61 trillion reflects the enormous amount of computational work being performed across the network before a block is successfully mined.
The first miner to discover a valid block earns the block reward, which currently consists of 3.125 BTC in newly issued bitcoin along with transaction fees paid by users included in the block. This reward system serves two purposes simultaneously. It introduces fresh Bitcoin into circulation while also financially incentivizing miners to contribute processing power that helps secure the network.
As per on-chain trends, hashrate and difficulty have continued trending upward over the years despite periods of volatility. Hashrate fluctuations often occur when miners shut down older machines, relocate operations, or respond to changing market conditions. Difficulty adjustments, then rebalance the network to maintain Bitcoin’s average 10-minute block interval.
This self-adjusting system became especially important during major disruptions such as China’s 2021 mining ban, when a significant portion of global mining operations suddenly went offline. Bitcoin’s difficulty mechanism adjusted downward automatically, allowing the network to continue operating normally while mining activity was gradually redistributed globally.
Today, Bitcoin mining remains one of the largest decentralized computing networks in the world, with network security directly tied to the enormous amount of computational power protecting the blockchain.
How Bitcoin Difficulty Adjustments Work
Bitcoin automatically adjusts mining difficulty every 2,016 blocks, or roughly every two weeks. If miners collectively add more computational power and blocks are produced too quickly, difficulty rises. However, it decreases if hashrate falls and blocks slow down. This mechanism helps Bitcoin maintain an average block time of approximately 10 minutes regardless of how much mining power exists globally.
The adjustment system is critical because it stabilizes Bitcoin’s monetary issuance schedule. Without difficulty adjustments, Bitcoin’s fixed supply schedule could accelerate unpredictably during periods of rising hashpower.
As mining competition intensified over the years, difficulty continued reaching new highs alongside hash rate growth. The current difficulty level of approximately 136.61 trillion reflects how many computational attempts miners must collectively perform before successfully discovering a valid block.
Bitcoin Halving and Supply Reduction
Bitcoin’s supply schedule follows a programmed issuance model known as the halving. Every 210,000 blocks, roughly every four years, the reward miners receive for producing blocks is reduced by 50%. This steadily slows the pace of new BTC entering circulation over time.
When Bitcoin launched in 2009, miners earned 50 BTC per block. Since then, multiple halving cycles have gradually reduced issuance:
2012: 50 BTC → 25 BTC
2016: 25 BTC → 12.5 BTC
2020: 12.5 BTC → 6.25 BTC
2024: 6.25 BTC → 3.125 BTC
Historically, Bitcoin halvings have often preceded major market cycles. The 2012 halving came before Bitcoin’s 2013 rally, the 2016 halving preceded the 2017 bull market, and the 2020 halving occurred before Bitcoin reached new all-time highs during 2021. Because halvings reduce the rate of new supply issuance, many investors closely monitor these cycles as part of Bitcoin’s long-term scarcity narrative.
When Was the Last Bitcoin Halving?
The latest Bitcoin halving occurred on April 20, 2024, at block height 840,000. During this event, Bitcoin’s block reward was reduced from 6.25 BTC to 3.125 BTC per block.
| Halving Count | Date | Block Height | Reward Before Halving | Reward After Halving |
| 1 | 2012-11-27 | 210,000 | 50 BTC | 25 BTC |
| 2 | 2016-07-09 | 420,000 | 25 BTC | 12.5 BTC |
| 3 | 2020-05-11 | 630,000 | 12.5 BTC | 6.25 BTC |
| 4 | 2024-04-20 | 840,000 | 6.25 BTC | 3.125 BTC |
| 5* | 2028-04-17 | 1,050,000 | 3.125 BTC | 1.5625 BTC |
| 6* | 2032 (Est.) | 1,260,000 | 1.5625 BTC | 0.78125 BTC |
| 7* | 2036 (Est.) | 1,470,000 | 0.78125 BTC | 0.390625 BTC |
Future halving dates are estimates based on projected block production times. The next Bitcoin halving is currently projected for around April 2028, when the block reward is expected to decline from 3.125 BTC to 1.5625 BTC per block.
Bitcoin’s Current Supply and Emission Schedule
Bitcoin’s issuance schedule is fully transparent and complete. Its total supply is permanently capped at 21 million BTC, making it one of the few fully transparent monetary systems. About 20.03 million BTC are already circulated, and about 20,033,450 BTC have been mined. That leaves about 966,700 BTC still to be issued over the coming decades.
Freshly minted bitcoins are still injected into the global circulation through mining rewards, but the issuance changes roughly every halving cycle. After the most recent mining halving in April 2024, miners earn a reward of 3.125 BTC. This amount will continue to decrease as the average block maturation rate slows by about 4 times until Bitcoin’s growth significantly slows.
According to Bitcoin’s programmed emission schedule, the last bit of BTC will be mined around the year 2140. After that, miners are expected to rely primarily on transaction fees instead of newly issued coins to help secure the network.
Bitcoin ETF and Institutional Demand
Institutional participation substantially changed the market structure of Bitcoin over the last few years. Initially, this retail asset attracted hedge funds, asset managers, corporations, pensions, and public companies. The most significant catalyst for market development was the breakthrough in spot Bitcoin ETFs. This opportunity to invest in Bitcoin via regulated financial markets is attractive for traditional investors who do not wish or have the means to manage the asset directly.
The approval of spot Bitcoin ETFs was a landmark moment in Bitcoin’s market development, as it further reached into the traditional investment world and brought about substantial institutional demand. In today’s market, many large institutions view Bitcoin alongside gold, equities, and commodities as a key component of global financial markets.
The Long Road to Spot Bitcoin ETF Approval
It took more than 10 years for the first Bitcoin ETF to be approved. The first application for a spot Bitcoin ETF was filed in July 2013 by Cameron and Tyler Winklevoss, who proposed the ticker “COIN.” That filing marked the beginning of a protracted legal battle between the crypto establishment and the U.S. Securities and Exchange Commission (SEC).
For years, the SEC repeatedly rejected proposals to launch spot Bitcoin ETFs. From 2017 through 2022, several proposals were denied because regulators deemed that crypto markets lacked robust surveillance-sharing agreements with similarly large regulated markets. Regulators also cited or remarked on concerns about market manipulation, custody security and investor protection.
While firms balked at approving spot ETFs, Bitcoin futures ETFs were eventually approved. In October 2021, ProShares was the first firm to launch a U.S. Bitcoin-linked ETF with the ProShares Bitcoin Strategy ETF (BITO). Unlike spot ETFs, BITO does not hold or own Bitcoin. Instead, BITO tracked Bitcoin futures contracts on the Chicago Mercantile Exchange (CME) and therefore was allowed to launch within the framework of existing regulated futures markets.
In August 2023, the U.S. Court of Appeals brought regulatory circumstances to a new peak with a ruling in Grayscale Investments LLC v. SEC that the SEC’s rejection of Grayscale’s spot Bitcoin ETF conversion proposal was “arbitrary and capricious.” The court said that the SEC had failed to properly explain why futures-based ETFs were acceptable, but spot ETFs were not.
That decision was one of the most significant legal turning points in the history of Bitcoin ETFs. The first spot Bitcoin ETFs were approved by the SEC on Jan. 10, 2024. The SEC granted approval to 11 spot Bitcoin exchange-traded products, which included BlackRock, Fidelity, Grayscale, Bitwise, and ARK 21Shares. The approval event was one of the most consequential milestones in Bitcoin’s active adoption cycle and opened the market to a much broader group of traditional investors.
Countries That First Approved Spot Bitcoin ETFs
Canada became the first country to approve a spot Bitcoin ETF when the Ontario Securities Commission approved the Purpose Bitcoin ETF (BTCC) in February 2021. Shortly afterward, the product began trading on the Toronto Stock Exchange. The launch attracted significant global attention and showed that regulated spot Bitcoin investment products could be successful in conventional financial markets.
Europe was also relatively early, with Liechtenstein launching the VanEck Bitcoin ETN in late 2020. In addition, Europe’s first spot Bitcoin ETF products were launched in 2023. The US only approved Bitcoin futures ETFs in 2021 but finally approved spot Bitcoin ETFs in January 2024 after years of regulatory resistance.
Subsequent jurisdictions in Asia also began to consider similar products. Hong Kong approved spot Bitcoin and Ether ETFs under regulated circumstances, and Singapore closely monitored the development as part of its broader digital asset regulatory strategy. Australia and Thailand also approved regulated Bitcoin investment products, but Thailand has limited participation to first to institutional and ultra-high-net-worth investors.
How Spot Bitcoin ETFs Work
Spot Bitcoin ETFs give investors access to Bitcoin via normal stock markets without the need to purchase, store, or manage Bitcoin directly. When investors buy into a spot Bitcoin ETF, the ETF issuer purchases Bitcoin on the open market and stores it with professional custodians who employ multiple layers of security, such as cold storage and offline wallets. Additionally, insurers, multi-signature authentication, and other methods are being evaluated to help reduce the probability of hacking and mitigate operational risks.
The ETF creates shares that represent the actual Bitcoin held in storage. Those shares are traded in normal stock markets, just like normal stocks or ETFs, with the value of the shares constructed to mirror closely the value of the fetched Bitcoin.
To help increase liquidity and pricing efficiency, authorized participants and market makers continuously create or redeem shares of the ETF as needed. Whenever there is demand for ETF shares, authorized participants can deliver Bitcoin to the ETF issuer in exchange for new ETF shares the issuer creates. When there is demand for redemptions, the process is the reverse. This structure provides a way for ordinary investors to round up exposure to Bitcoin without having to handle private keys, crypto wallets or cryptocurrency exchanges directly.
Why BlackRock and Fidelity Entering the Market Was Important
The emergence of leading asset managers like BlackRock and Fidelity marked a turning point for Bitcoin on both institutional and psychological fronts. For years, Bitcoin has been seen as a niche or speculative asset class, known primarily to retail traders and crypto enthusiasts. Having major asset managers get involved was a huge signal for the market.
BlackRock manages trillions of dollars in assets globally. It has long-standing relationships with pension funds, sovereign wealth funds, insurance companies, and other major investors. BlackRock’s move into the Bitcoin ETF space was a strong indication of the growing institutional support for Bitcoin as a serious store of value and hedge against multiple risks.
By entering into the Bitcoin strategy, these firms provided investors with confidence and assurance. Institutional investors often favored regulated financial products because they are regulatory-compliant entities designed to minimize compliance, operational and record-keeping costs for investors.
ETF Flows and Bitcoin Market Structure
ETF inflows and outflows now play a major role in Bitcoin’s short-term liquidity conditions and broader market structure. Whenever large amounts of capital flow into spot Bitcoin ETFs, issuers must acquire additional Bitcoin from the open market to back newly created ETF shares. This creates additional buying pressure and can reduce the amount of Bitcoin available on exchanges.
Because Bitcoin has a fixed supply and relatively low daily issuance compared to traditional assets, sustained ETF accumulation can significantly tighten market liquidity. Periods of strong ETF inflows have often coincided with bullish sentiment and rising Bitcoin prices. Institutional demand has increasingly become one of the largest drivers of Bitcoin’s current market structure. Outflows can create the opposite effect. If investors aggressively sell ETF shares, issuers may need to reduce Bitcoin holdings, increasing selling pressure in the broader market.
Institutional Capital Rotation Into Bitcoin
Institutional investors view Bitcoin fundamentally differently from short-term retail traders. Many retail participants focus on short-term volatility and quick trading opportunities. Meanwhile, institutional players look out for long-term investment goals.
When making decisions, these traders are often focused on inflation expectations, monetary policy, currency debasement, liquidity, diversification, and risk-adjusted returns over time. Some institutions buy Bitcoin as a way to protect against inflation and the loss of purchasing power in traditional currencies.
Many investors compare Bitcoin to gold because of its fixed supply and global accessibility. It is also portable and more resistant to monetary dilution. This has helped undergird the Bitcoin-as-“digital gold” narrative over the past decade.
Treasury Accumulation and Strategic Bitcoin Reserves
Corporate and government Bitcoin accumulation introduced a new category of long-term holders into the market. Some institutions view Bitcoin as protection against inflation and currency debasement. Others see it as a strategic reserve asset tied to the long-term growth of digital finance infrastructure.
One of the most influential examples of corporate Bitcoin adoption came from Strategy, formerly known as MicroStrategy. In 2020, the company began converting portions of its corporate treasury reserves into Bitcoin under Executive Chairman Michael Saylor’s leadership. Over time, Strategy expanded its accumulation strategy aggressively through cash reserves, stock issuance, and convertible debt financing. As of June 7, 2026, Strategy holds approximately 843,706 BTC, acquired for roughly $51.85 billion at an average purchase price near $66,384 per Bitcoin.
Public companies can hold Bitcoin on their balance sheets as part of their treasury reserves. Central banks and sovereign programs can also run small digital-asset pilots that include BTC alongside stablecoins or tokenized deposits. These demand channels are real, but they do not change Bitcoin’s issuance rules or remove the need to understand settlement, security, and self-custody basics covered on this page.
Government Interest in Strategic Bitcoin Reserves
Governments have more recently been experimenting with Bitcoin reserves. On March 6, 2025, U.S. President Donald Trump signed Executive Order 14233 creating a Strategic Bitcoin Reserve and U.S. Digital Asset Stockpile. The order instructed the government to hold some of its seized Bitcoin holdings as long-term strategic assets rather than sell them through criminal and civil forfeiture processes.
Under the reserve framework, the U.S. Treasury can separately account for Bitcoin from other confiscated digital assets. The assets obtained through criminal and civil forfeiture cases made up the bulk of the reserve.
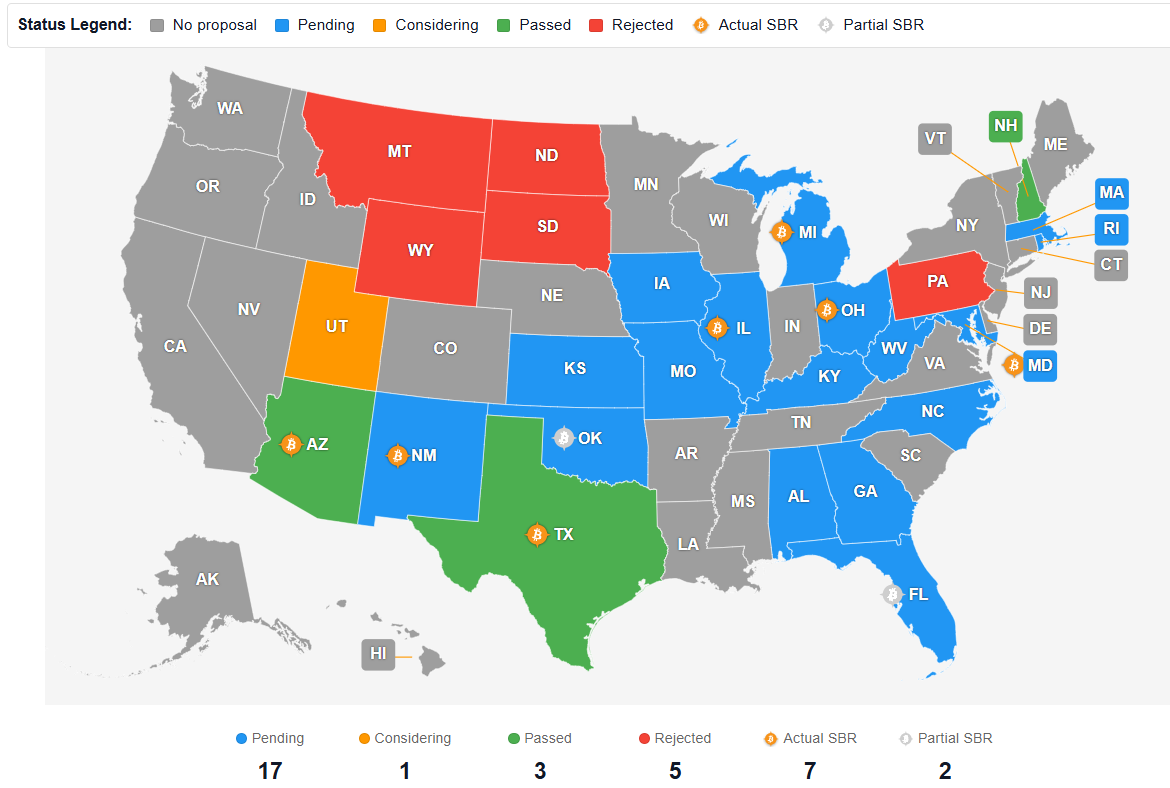
Image Source: BitcoinReserveMonitor
Several U.S. states have also explored strategic Bitcoin reserve legislation as interest in digital asset treasury strategies continues to expand across the country. New Hampshire became the first U.S. state to legally authorize strategic digital asset reserve exposure, allowing the state treasurer to allocate up to 5% of certain public funds into qualifying digital assets and precious metals. Due to strict market capitalization requirements, Bitcoin is currently the primary eligible digital asset under the framework.
Texas and Arizona also passed reserve-related legislation, positioning them among the earliest adopters of state-level Bitcoin policy. Texas, in particular, is notable for its sizable Bitcoin mining sector, energy infrastructure, and relatively welcoming environment for digital asset innovation.
Beyond the states that have already passed legislation, Bitcoin reserve proposals continue spreading across the United States. Currently, 17 states still have pending reserve-related proposals under review, while one state remains in a formal consideration phase. Meanwhile, five states have rejected proposed reserve legislation. Reasons pointed out include volatility, custody security and fiduciary responsibility.
The pending category consists of Florida, Georgia, North Carolina, Michigan, Ohio, Illinois, Maryland, Alabama and Kansas, among others. The wide geographic spread of these proposals indicates that discussions of Bitcoin reserves have moved beyond the classic crypto-friendly states. Bitcoin is increasingly part of mainstream policy discussions surrounding treasury diversification, inflation protection and long-term financial resilience.
In addition to legislative proposals, some jurisdictions have already moved toward operational reserve exposure. Current data shows seven states classified under “Actual Strategic Bitcoin Reserve” structures and two states operating under “Partial Strategic Bitcoin Reserve” frameworks. Partial reserve structures may include limited treasury authority, pilot programs, retained seized Bitcoin assets, or legislation establishing reserve frameworks without requiring immediate purchases.
Nation-State Bitcoin Holdings
Many governments now hold measurable amounts of Bitcoin through regular purchases, mining activities or seizures. El Salvador was the first country to adopt BTC as legal tender in 2021 and continues to hold the asset in its national reserves. As of May 2026, the country holds approximately 7,651 BTC.
Bhutan became another major state-backed Bitcoin holder following its state-financed hydropower mining program. By 2026, Bhutan had accumulated an estimated 4,973 BTC through state-supported mining activities. In addition to governments, some companies hold large amounts of Bitcoin. One example is Tether, the company behind the USDT stablecoin, which has accumulated a significant Bitcoin reserve over time.
Bitcoin Macro and Policy Risk
Bitcoin has long traded outside the conventional financial system. In recent years, macroeconomic conditions have become one of the strongest drivers of Bitcoin price action. The trend accelerated as institutional participation grew through spot ETFs, hedge funds, publicly traded companies, derivatives market exposure and traditional financial firms.
In Bitcoin’s earlier days, price movements were mostly driven by internal crypto-market activity. Factors such as exchange flows, retail speculation, mining cycles, and adoption growth played a much larger role. But today, Bitcoin increasingly trades alongside traditional financial markets, including equities, bonds, commodities, and foreign exchange markets.
As a result, interest rates, inflation, central bank liquidity, bond yields, government policy decisions, and U.S. dollar strength now have a major impact on Bitcoin investor behavior. When economic conditions are favorable and investors are willing to take on more risk, Bitcoin often behaves like a high-growth investment. During these periods, money tends to flow into assets that offer higher return potential.
However, in times of uncertainty and fears of currency debasement, the asset is increasingly compared to gold and other scarce assets. Because of this growing relationship, macroeconomic analysis has become increasingly important for understanding Bitcoin price trends and broader crypto market behavior.
Why Does the Federal Reserve Matter for Bitcoin?
Because the Federal Reserve determines interest rates and overall U.S. monetary policy, it has a major impact on global financial conditions. Since the U.S. dollar serves as the world’s reserve currency, Federal Reserve policy affects liquidity conditions across nearly every major market globally, including cryptocurrencies.
When the Fed cuts rates or adds liquidity into the financial system through quantitative easing (QE), borrowing becomes cheaper, and capital flows more easily into higher-risk assets. Historically, Bitcoin has often performed well during periods of monetary expansion and loose financial conditions.
In contrast, when the Federal Reserve raises interest rates or reduces liquidity through quantitative tightening (QT), financial conditions tighten. Investors can earn safer returns through government bonds and cash-like instruments, reducing their appetite for speculative assets such as Bitcoin.
This relationship was especially evident in the COVID era. In 2020 and 2021, central banks and governments pumped huge stimulus into the global economy via low interest rates, bond purchases, and fiscal stimulus spending. Global liquidity increased, risk appetite increased sharply, and Bitcoin rallied from under $10 000 in 2020 to almost $69 000 by late 2021.
The opposite happened in 2022 when inflation accelerated sharply, and the Federal Reserve promised to ignite one of its fastest tightening cycles in decades. In addition to higher rates and Treasury yields, aggressive quantitative tightening drained liquidity across various financial markets. Bitcoin fell more than 70% from its all-time high during that tightening cycle as speculative activity declined and leverage across crypto markets unwound.
These links mean that BTC investors now closely follow Fed policy decisions, Treasury yields, inflation data, quantitative tightening programs and general liquidity conditions when conducting market analysis. These macro factors are increasingly determining the direction of capital flows in the traditional and crypto markets.
Meanwhile, institutional investors no longer consider Bitcoin purely as a standalone cryptocurrency. In fact, many now analyze Bitcoin in a broader macro and portfolio context, against a backdrop of equities, bonds, commodities and other global risk assets.
What Is the FOMC and Why Does Crypto React So Strongly?
The Federal Open Market Committee (FOMC) is the main policy-making body of the Federal Reserve that sets U.S. interest rates. The committee meets eight times a year to review inflation, employment, economic growth and financial conditions. Markets pay close attention to FOMC meetings because interest rate decisions directly influence liquidity conditions and investor risk appetite.
The Fed generally has three primary policy options:
- Raise rates to slow inflation and reduce economic overheating.
- Lower rates to stimulate borrowing and economic activity.
- Hold rates steady while monitoring incoming data.
Cryptocurrency markets often react violently around FOMC meetings because Bitcoin is highly sensitive to changes in liquidity expectations. Traders attempt to anticipate future policy direction months in advance, meaning price volatility often reflects expectations rather than the actual decision itself.
This created a major “sell the news” dynamic throughout 2025. Even during periods when the Federal Reserve began cutting rates, Bitcoin frequently declined after FOMC announcements because traders had already positioned for those outcomes beforehand.
Bitcoin rallied after only one of eight FOMC meetings in 2025 despite the start of a rate-cutting cycle. This demonstrated that market expectations and positioning can sometimes matter more than the policy change itself.
For example:
| Meeting | Fed Decision | BTC Performance (48 Hours) |
| January 2025 | Hold | -27% |
| March 2025 | Hold | -14% |
| May 2025 | Cut (0.25%) | +15% |
| June 2025 | Hold | -8% |
| July 2025 | Hold | -6% |
| September 2025 | Cut (0.25%) | -7% |
| October 2025 | Cut (0.25%) | -29% |
| December 2025 | Cut (0.25%) | -9% |
Bitcoin slumped again in January 2026 after the Fed decided to keep rates unchanged at 3.5%–3.75%. The asset fell from almost $90,400 to almost $83,000 in 48 hours after the announcement. This underlines how much the crypto markets are still riding on expectations of money‑supply policy.
Inflation and Bitcoin’s “Digital Gold” Narrative
Bitcoin’s fixed supply of 21 million coins contributed to its image as a hedge against both inflation and currency debasement. Unlike fiat currencies, Bitcoin’s monetary policy is hardcoded and cannot be expanded by governments or central banks.
Advocates say this scarcity factor contributes to Bitcoin’s intrinsic gold-like properties during times of inflationary purchasing power loss. The narrative gained significant attention after the massive monetary expansion that followed the COVID-19 pandemic. Governments expanded spending, and central bank balance sheets expanded aggressively.
As inflation subsequently exploded globally, investors reexamined Bitcoin’s performance during periods of inflation. The April 2026 U.S. Consumer Price Index (CPI) report showed that inflationary pressures have persisted in the economy. Consumer prices increased 0.6% MoM and 3.8% YoY, the highest annual inflation rate since May 2023.
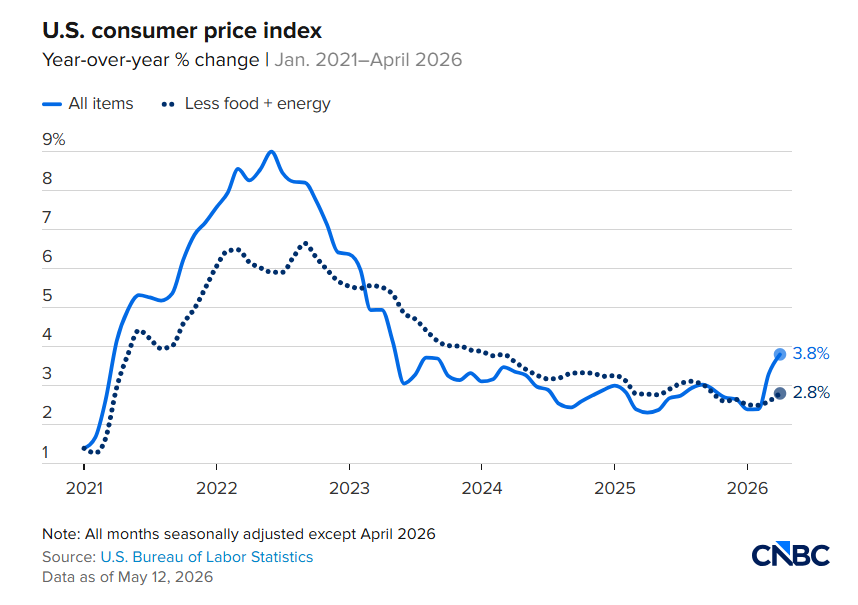
Image Source: CNBC
In the 12-page report, energy costs were an important driver of the climb. Gasoline prices jumped 28.4% y/y, while overall energy prices rose 17.9%. Shelter costs were up 0.6%, airline fares rose 20.7% y/y, and food costs continued to accelerate.
The data confirmed worries that the Federal Reserve may need to maintain strict monetary policy longer than markets expected. The chart below shows how monthly U.S. CPI readings rebounded sharply in early 2026 after easing most of 2024 and 2025. The sharp uptick reflected renewed inflationary pressure from the spot of energy markets and global geopolitical turmoil.
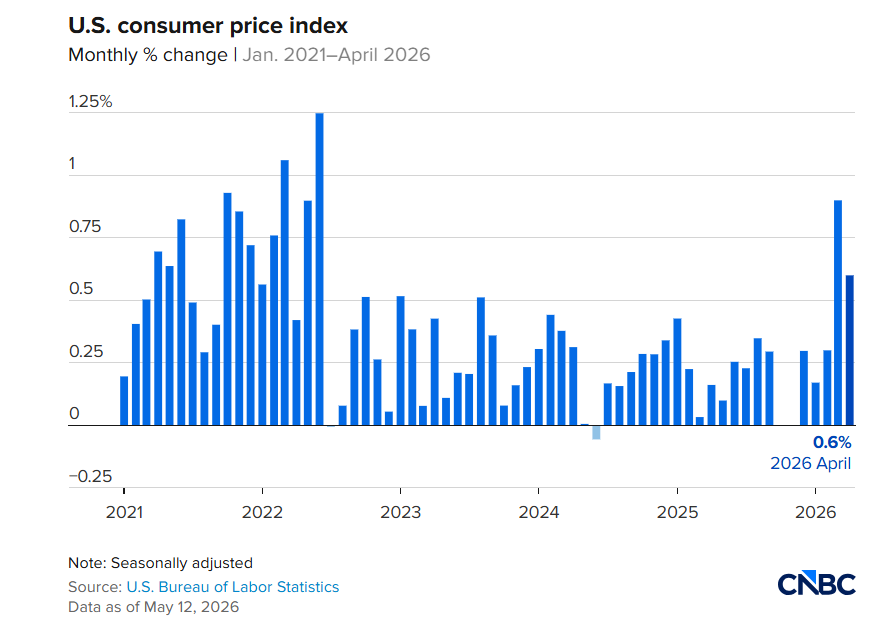
Image Source: CNBC
Inflation spiked in 2021 and 2022 and remained a concern in the years that followed. At one point, consumer prices rose more than 1.2% in a month. Even in April 2026, prices went up another 0.6%, hinting that inflation had not snapped back into place.
Bitcoin is said to be a hedge against inflation because its supply is capped at 21 million coins. For that reason, many investors looked forward to higher inflation for Bitcoin. The outcome turned out to be more complicated. High inflation pressured the Federal Reserve to hike interest rates aggressively.
The situation panned out in 2022 when inflation was up at its highest in decades. Yet Bitcoin suffered its biggest drop in history. Markets responded to tight monetary policy and lower liquidity. The lesson is that Bitcoin does not react to inflation alone. Liquidity and central bank policy can weigh just as heavily on price. Even so, more investors view Bitcoin as a long-term alternative to fiat currencies since its supply cannot be expanded by governments or central banks.
The Fed’s Balance Sheet and Liquidity Cycles
Beyond interest rates, the Federal Reserve also influences financial markets through its balance sheet operations, which directly affect overall liquidity in the economy. When the Fed wants to support growth and increase liquidity, it can use quantitative easing (QE), a process where it purchases government bonds and other financial assets to inject money into the financial system. Quantitative tightening (QT) works in the opposite direction by reducing the Fed’s balance sheet and removing liquidity from markets.
Bitcoin has historically performed strongly during periods of expanding liquidity, while aggressive liquidity tightening has often created pressure across crypto markets. Because of this relationship, analysts closely monitor factors such as the Federal Reserve’s balance sheet size, M2 money supply, and other global liquidity conditions.
When liquidity expands rapidly, investors generally become more willing to take risks, and capital tends to flow more aggressively into higher-risk assets like cryptocurrencies. During periods of tightening liquidity, however, leverage declines and investors often shift capital toward safer assets such as government bonds and cash. This is one reason Bitcoin is frequently described as a “global liquidity barometer,” as its price movements often reflect broader changes in financial conditions worldwide.
Why Does Dollar Strength Affect Bitcoin?
The U.S. Dollar Index (DXY) measures the strength of the U.S. dollar relative to a basket of major foreign currencies. Dollar strength has historically shown periods of inverse correlation with Bitcoin and broader risk assets. When the U.S. dollar strengthens, global liquidity conditions often tighten. Investors tend to shift capital toward safer assets, such as cash and U.S. government bonds, thereby reducing demand in speculative markets. Meanwhile, liquidity conditions generally improve when the dollar weakens. And in light of this, risk appetite increases, and alternative assets such as Bitcoin often perform more strongly.
Historically, several major Bitcoin rallies coincided with periods of declining DXY strength:
- The 2020–2021 Bitcoin bull market occurred while the dollar weakened significantly following pandemic-era stimulus.
- Bitcoin’s recovery during parts of 2023 also coincided with periods of falling Treasury yields and a softer dollar.
- Conversely, Bitcoin experienced substantial pressure during the aggressive dollar rally of 2022 as the Federal Reserve tightened policy rapidly.
Looking at the “Bitcoin vs DXY Correlation” chart below, periods of sustained dollar strength have frequently coincided with weaker Bitcoin performance and tighter financial conditions globally.
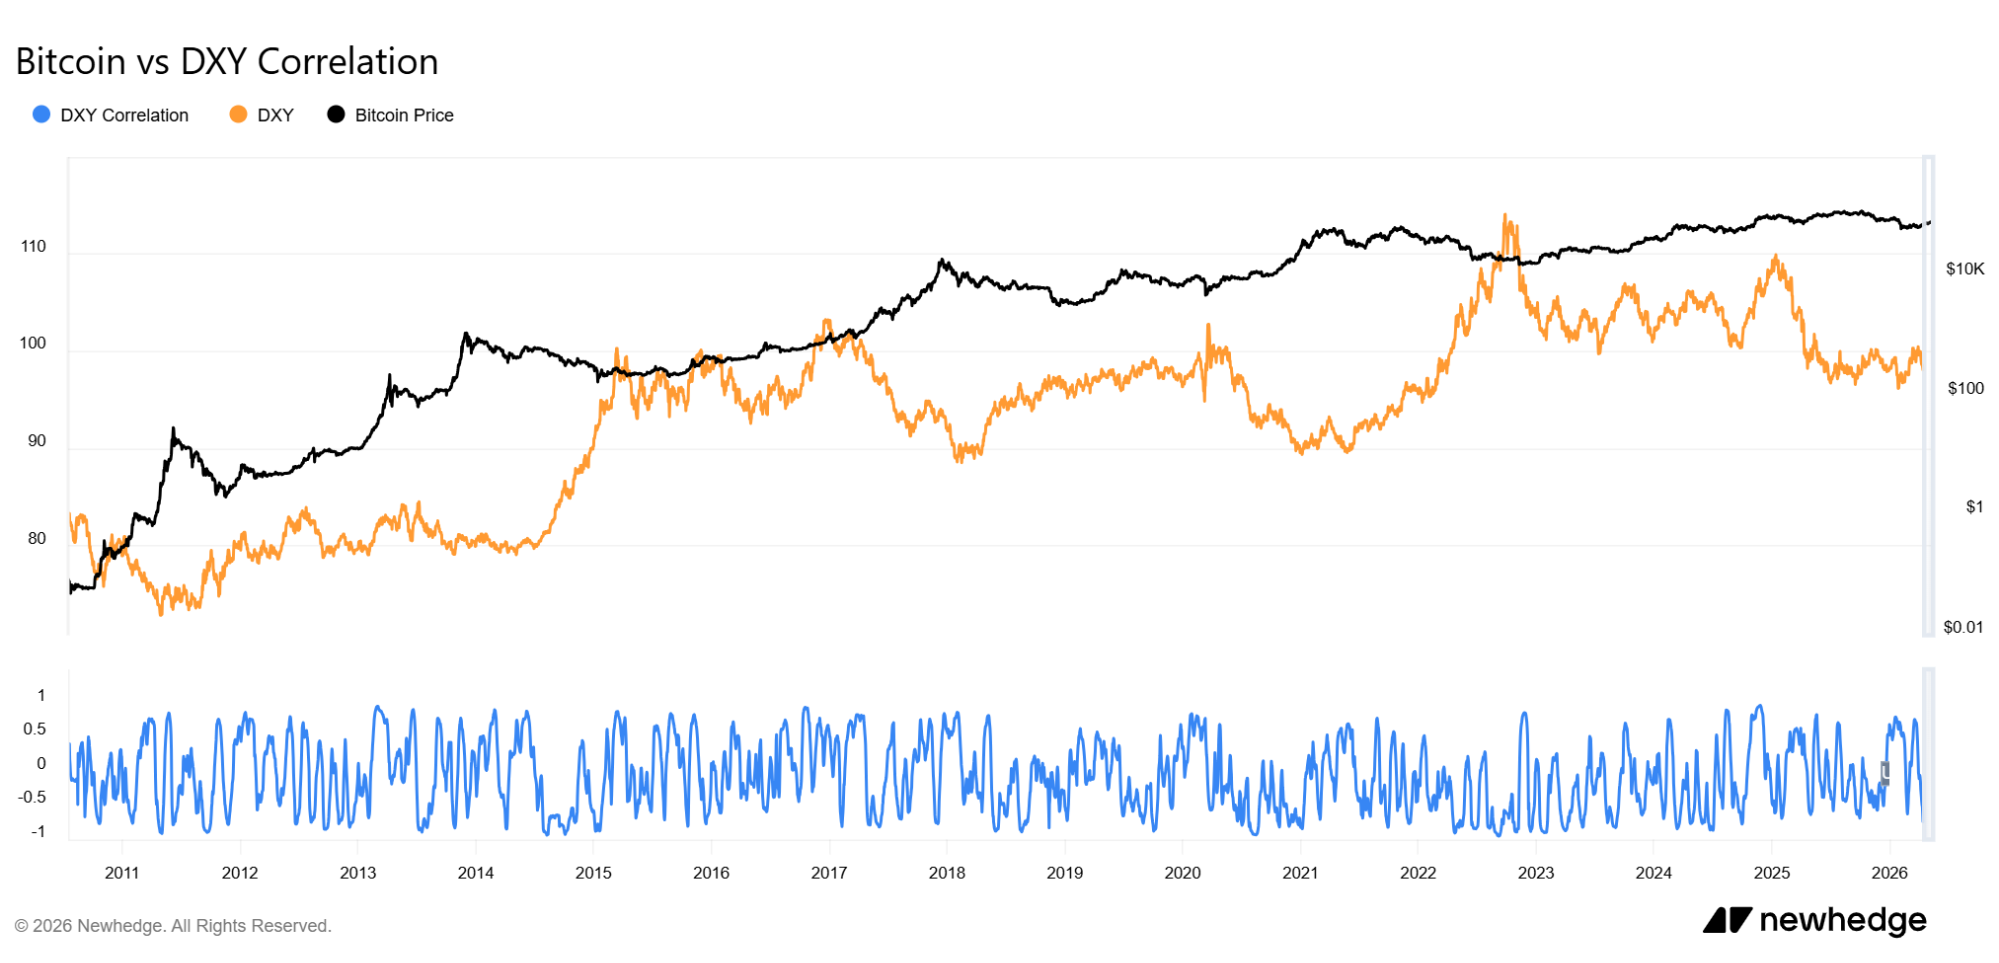
Image Source: NewHedge
The blue correlation line demonstrates that Bitcoin’s relationship with the dollar is not perfectly consistent at all times. However, sustained periods of negative correlation have repeatedly appeared during major macroeconomic cycles.
This relationship matters because the dollar effectively influences global liquidity conditions. A stronger dollar increases financial pressure internationally, particularly for countries and institutions with dollar-denominated debt obligations.
As a result, crypto analysts frequently monitor DXY movements alongside Treasury yields, inflation data, and Federal Reserve policy when evaluating Bitcoin market conditions.
Why Bitcoin Sometimes Trades Like Tech Stocks
Over the last several years, Bitcoin has become increasingly connected to traditional financial markets, especially technology stocks. One major reason for this shift is growing institutional adoption. As hedge funds, asset managers, ETFs, and trading firms entered the crypto market, Bitcoin gradually became part of broader investment portfolios instead of trading as a completely separate asset class.
As a result, Bitcoin now reacts more strongly to overall market sentiment, stock market volatility, Treasury yields, liquidity conditions, and major macroeconomic events. When liquidity is strong and investors are willing to take on more risk, capital often flows into both technology stocks and cryptocurrencies at the same time. However, when financial conditions tighten and borrowing costs rise, both markets usually face pressure together.
This relationship became especially clear in 2022, when aggressive Federal Reserve interest rate hikes triggered major declines in both the Nasdaq and Bitcoin markets. At other times, however, Bitcoin behaves differently from traditional risk assets and is viewed more like a scarce alternative asset similar to gold. This usually happens during periods of banking instability, sovereign debt concerns, or fears surrounding currency debasement.
Geopolitical Risk and Bitcoin Markets
Geopolitical tensions have also become increasingly important drivers of Bitcoin volatility. Conflicts, trade wars, and even sanctions can all affect global liquidity conditions, as well as investor risk appetite. The 2026 inflation resurgence demonstrated this clearly. Energy prices surged following escalating geopolitical tensions and instability surrounding Iran, pushing oil prices above $100 per barrel and gasoline prices toward $4.50 nationally in the United States.
Higher energy prices contributed directly to rising inflation pressures, which complicated the Federal Reserve’s ability to cut rates despite slowing economic momentum elsewhere. This created additional uncertainty for crypto markets because Bitcoin remains highly sensitive to changing liquidity expectations.
At the same time, some investors increasingly view Bitcoin as a geopolitically neutral asset because it operates independently from sovereign monetary systems and can move globally without reliance on traditional banking infrastructure. Bitcoin’s dual role as a speculative risk asset and as a decentralized monetary alternative continues to shape its position within the global financial system.
Bitcoin Onchain and Market Structure Signals
Bitcoin’s blockchain generates a huge amount of public data. Analysts use this data to study investor behavior, capital flows, liquidity conditions, and overall market sentiment. Unlike traditional financial systems, much of Bitcoin’s data can be tracked in real time.
Over the years, this transparency created an entirely new area of research known as onchain analysis. Analysts combine blockchain activity with derivatives data, ETF flows, macroeconomic conditions, and trading activity to better understand how money moves through the Bitcoin ecosystem.
Onchain analysis focuses on activity happening directly on the blockchain. This includes exchange inflows and outflows, wallet behavior, realized profits and losses, and long-term holder accumulation. Meanwhile, market structure analysis studies derivatives positioning, leverage, liquidity, volatility, and futures activity.
However, no single metric works perfectly on its own. Exchange inflows alone cannot confirm a market top. Likewise, rising leverage alone cannot guarantee a reversal. Because of this, experienced analysts combine multiple indicators before drawing conclusions about Bitcoin’s direction.
Why Exchange Inflows and Outflows Matter
One of the most important on-chain metrics involves tracking Bitcoin moving into and out of crypto exchanges. These flows help analysts estimate buying pressure, selling pressure, and investor conviction.
Liquidity refers to how easily an asset can be bought or sold without heavily affecting price. Exchange balances matter because they represent Bitcoin that is readily available for trading. When Bitcoin moves onto exchanges, it becomes easier to sell. On the other hand, when Bitcoin leaves exchanges, it is often moved into long-term storage or institutional custody.
What Exchange Inflows Usually Signal
Exchange inflows happen when investors transfer Bitcoin onto trading platforms. Large inflows often suggest that holders may be preparing to sell, take profits, or reduce risk exposure. When more Bitcoin enters exchanges, the amount of tradable supply increases. And if demand remains stable while supply rises sharply, selling pressure can grow. Historically, strong inflow periods have often appeared during market corrections, panic events, or uncertain macroeconomic conditions.
Large inflows may also occur after negative news, regulatory fears, or sudden volatility. During these periods, investors often move Bitcoin onto exchanges to prepare for liquidation. Institutional and whale activity can amplify these trends. When large holders transfer substantial amounts of Bitcoin onto exchanges, traders may interpret the move as a possible sign of upcoming selling pressure.
During the 2021 bull market, exchange inflows and trading volumes surged across major platforms such as Binance and Coinbase. This happened as Bitcoin climbed toward new all-time highs above $60,000. At the same time, leverage and speculation increased sharply, leading to violent price swings in both directions.
In another example, digital asset investment products reportedly recorded about $2.2 billion in inflows during a major accumulation period ahead of the U.S. elections. This pushed year-to-date inflows to roughly $29.2 billion. Bitcoin-related products accounted for most of those flows, highlighting the growing role of institutional demand in crypto markets.
What Exchange Outflows Usually Signal
Exchange outflows happen when Bitcoin leaves exchanges and moves into external wallets or custodial storage. Analysts often interpret sustained outflows as a sign of accumulation and long-term holding behavior.
When investors withdraw Bitcoin from exchanges, the amount of immediately tradable supply decreases. If demand remains strong while exchange supply falls, upward price pressure can gradually build over time. This trend became increasingly important after 2020 as institutions, ETFs, and long-term holders accumulated large amounts of Bitcoin while exchange reserves declined steadily.
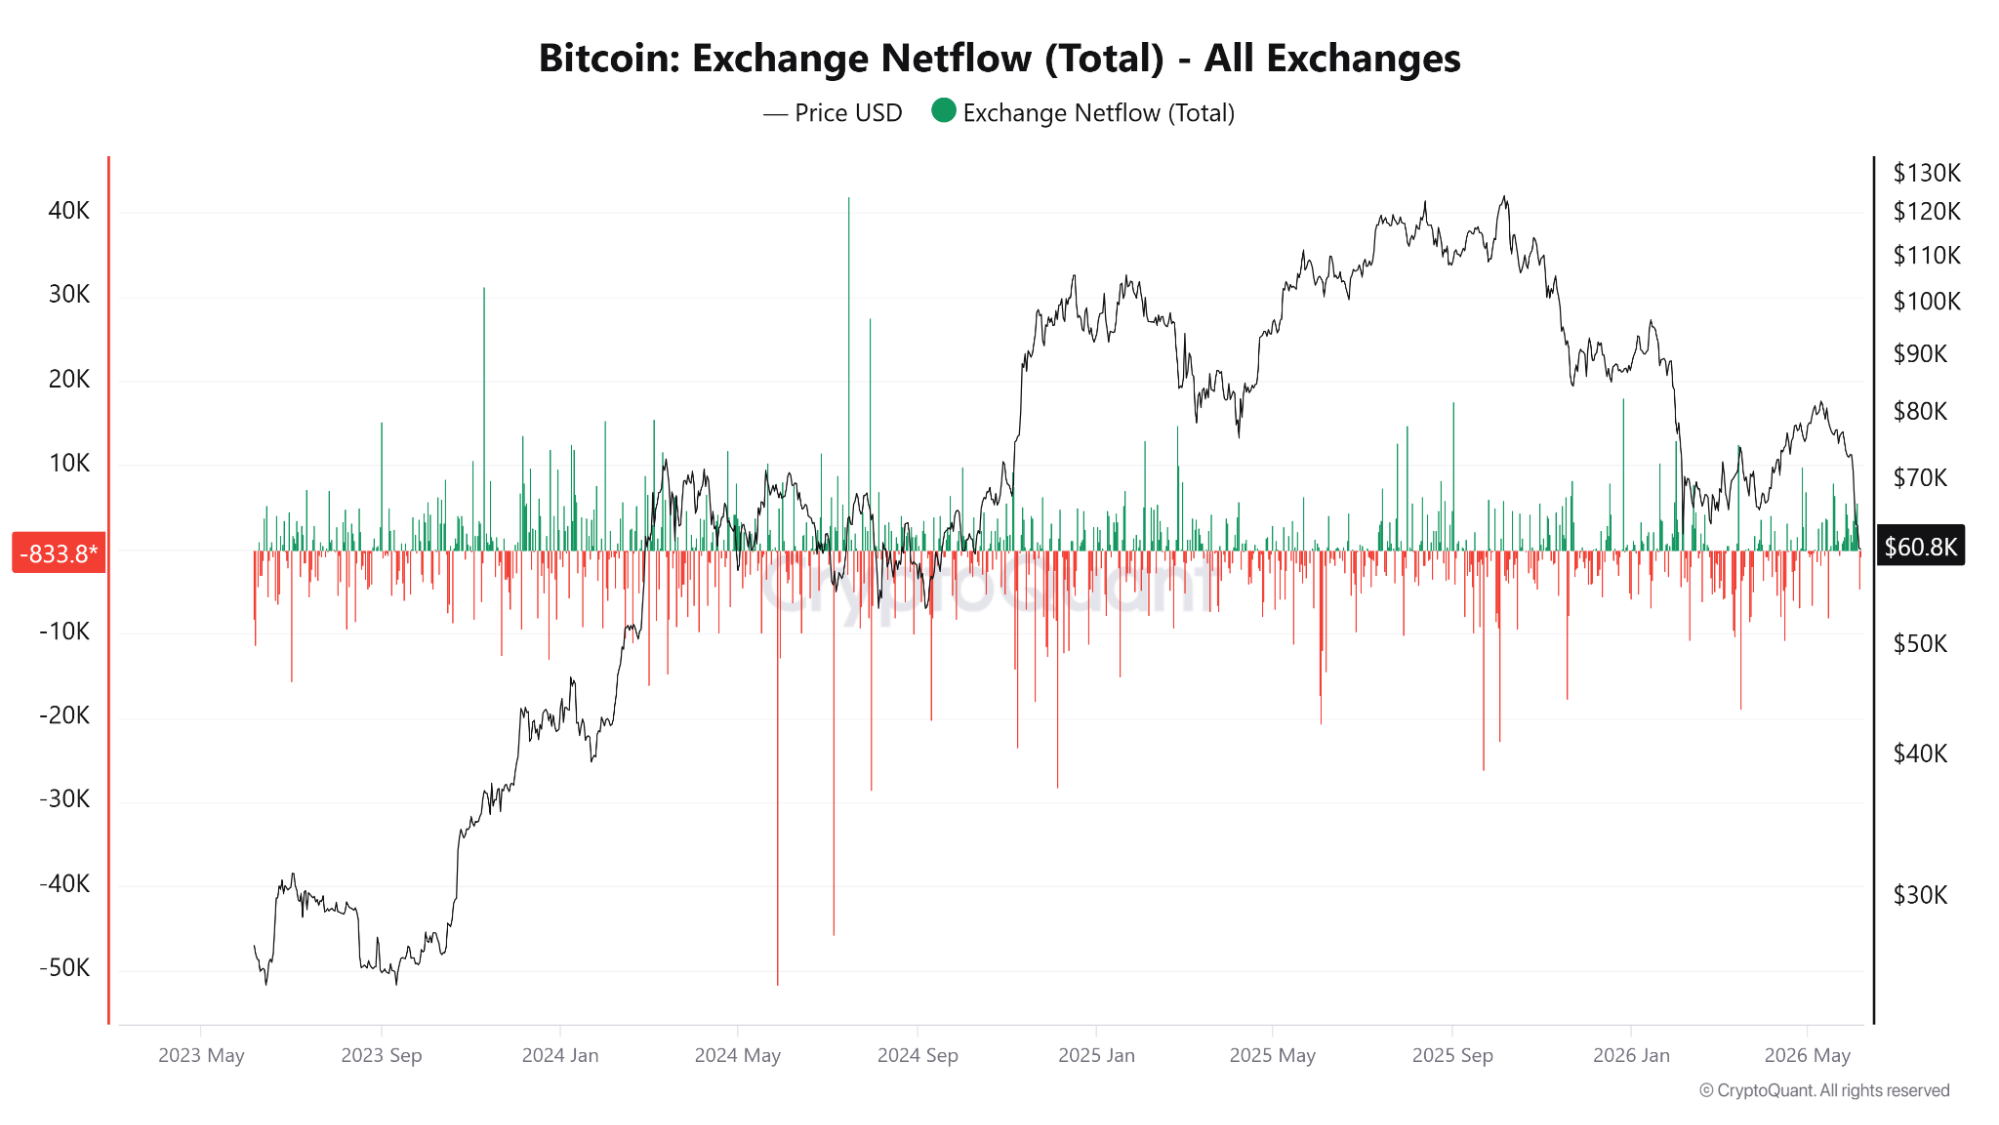
Image Source: CryptoQuant
Looking at the chart above, strong outflows often occurred during accumulation phases and longer-term bullish trends. Meanwhile, sudden inflow spikes frequently happened during periods of panic, corrections, or profit-taking activity.
Large exchange outflows can sometimes reflect institutional accumulation. For example, Kraken reportedly recorded one of its largest Bitcoin outflows on May 30, 2024. Around 28,000 BTC, worth roughly $1.6 billion at the time, left the exchange while Bitcoin traded above $69,000. The movement reduced Kraken’s exchange reserves to their lowest level since 2020.
Bitcoin Supply in Profit and Loss
Another important on-chain metric is Bitcoin’s supply in profit and loss. This metric measures how much of Bitcoin’s circulating supply is currently above or below its realized price. The realized price refers to the price at which coins last moved on-chain.
If Bitcoin’s market price is higher than the price at which coins last moved, those coins are considered “in profit.” If the market price falls below the last moved price, those coins are considered “in loss.”
Analysts monitor this metric closely because it helps reveal market psychology and investor behavior. When a very large percentage of the Bitcoin supply is in profit, many investors are sitting on unrealized gains. Under these conditions, markets may experience increased profit-taking pressure as holders lock in gains.
On the other hand, when large portions of supply move into loss, markets often enter capitulation phases. These periods usually coincide with fear, forced selling, and long-term accumulation opportunities.
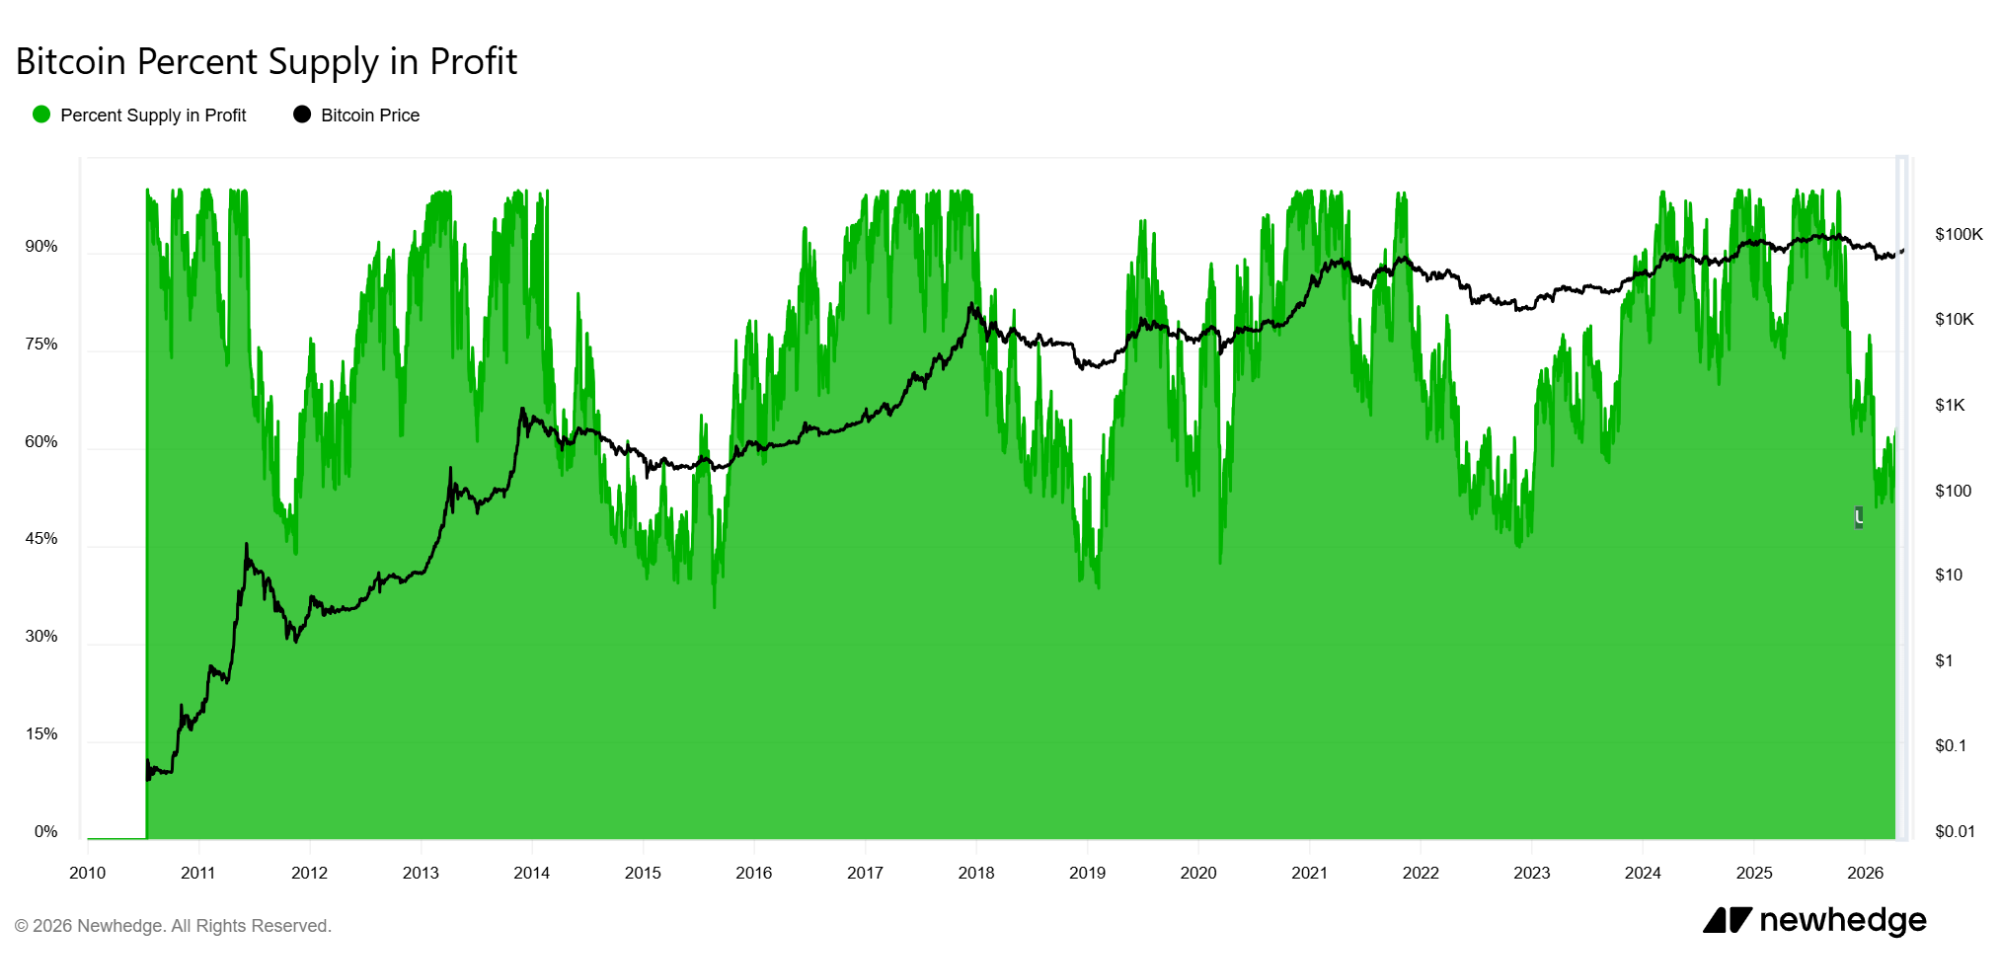
Image Source: NewHedge
Historically, Bitcoin bull markets have pushed the percentage of supply in profit above 80% and sometimes above 90% for extended periods. Under euphoric conditions, most holders remain profitable simultaneously. This can increase the probability of profit-taking and higher volatility. By contrast, major bear market bottoms saw supply in profit decline sharply as many investors moved underwater. This includes the 2014–2015 downturn, the 2018 bear market, and the 2022 collapse following the Terra and FTX collapses.
Bitcoin Whales and Market Liquidity
Large Bitcoin holders, commonly known as whales, also play an important role in market analysis. A Bitcoin whale is usually an individual, institution, exchange, or entity holding enough BTC to influence liquidity conditions or market sentiment. Since Bitcoin ownership is publicly visible on-chain, traders often monitor whale wallets and large transfers for clues about market activity.
Blockchain data shows that a relatively small number of wallets still control a significant percentage of Bitcoin’s circulating supply. Some of the largest addresses belong to exchanges, custodians, ETFs, or dormant wallets that rarely move funds.
Whale activity matters because large holders can affect liquidity and volatility. When whales accumulate aggressively and withdraw coins from exchanges, liquid supply can tighten. Conversely, when whales move large amounts of Bitcoin onto exchanges, traders may interpret it as a potential sign of selling pressure.
Funding Rates and Leverage Conditions
Funding rates are one of the most important tools for measuring sentiment in Bitcoin perpetual futures markets. Perpetual futures contracts allow traders to speculate on Bitcoin’s price using leverage without expiration dates. Funding rates help keep perpetual contract prices aligned with spot market prices. When funding rates are positive, long traders pay short traders. This usually signals bullish positioning and aggressive long exposure.
Meanwhile, negative funding rates often reflect bearish positioning and stronger short exposure. Moderately positive funding rates are common during healthy uptrends. However, extremely high funding rates can signal excessive leverage and speculative overheating.
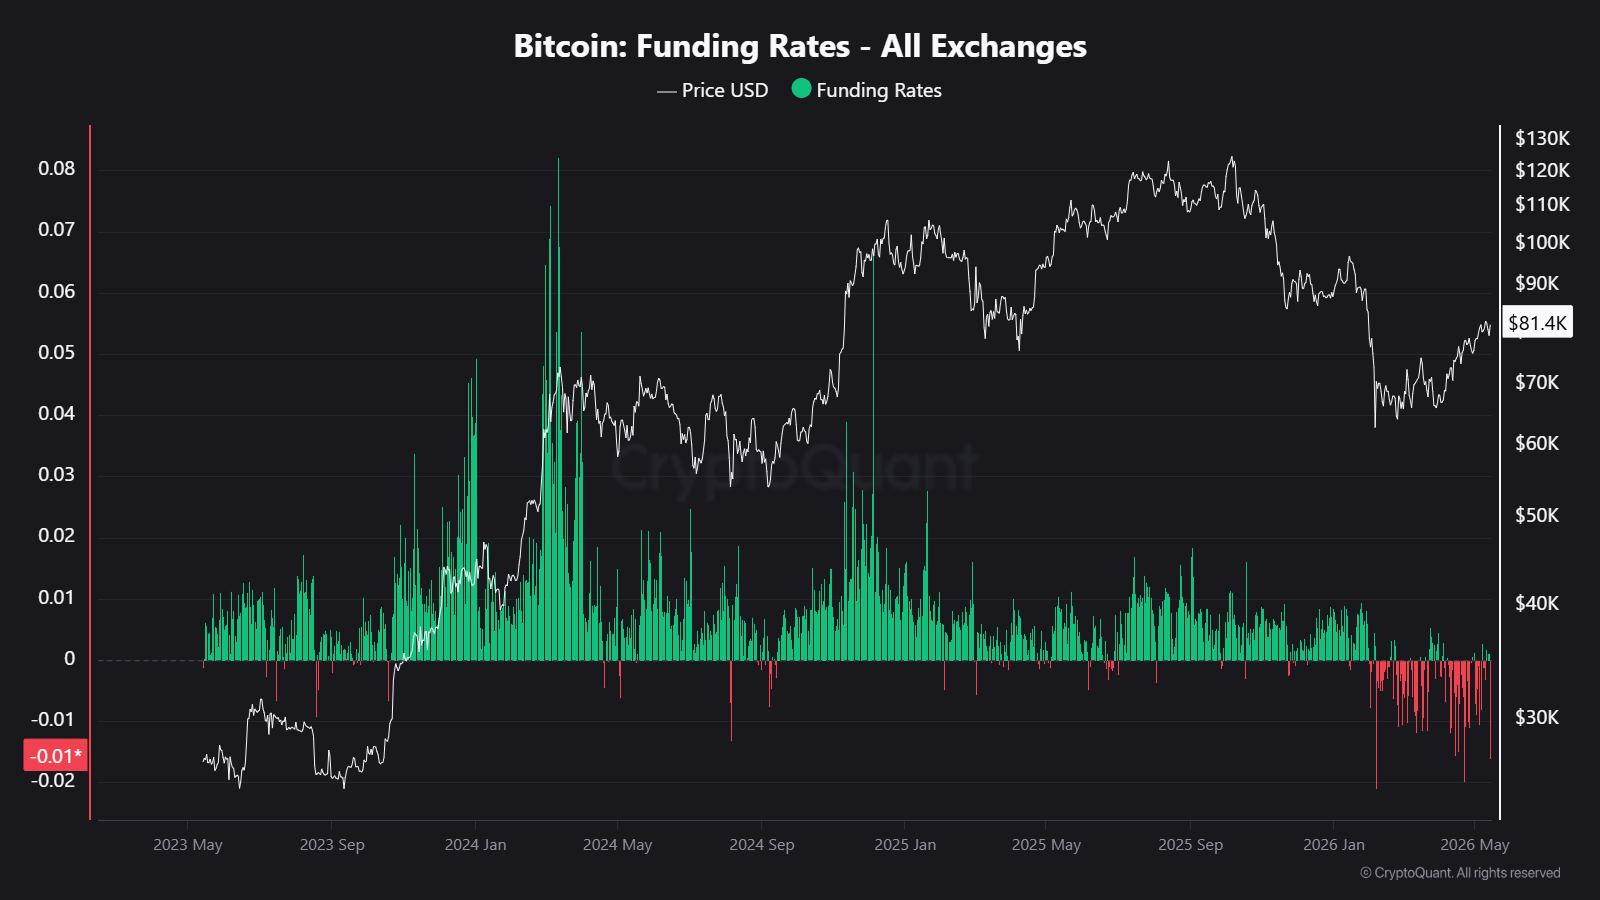
Image Source: Coinglass
Historically, Bitcoin markets have experienced sharp corrections after leverage built too aggressively across derivatives exchanges. Once liquidations begin, forced selling can accelerate price declines. This happened several times during the 2021 bull market. Overheated leverage conditions triggered cascading liquidations that wiped out billions of dollars in futures positions within hours.
What Open Interest Reveals About Market Positioning
Open interest measures the total value of active futures contracts that remain open across derivatives markets. Unlike trading volume, which measures transactions during a specific period, open interest tracks outstanding positions that have not been closed, liquidated, or settled. If new traders enter the market and open additional futures positions, open interest rises. If traders close positions or get liquidated, open interest falls.
According to CryptoQuant, open interest expanded sharply during major rallies as leverage increased across derivatives markets. At several points, open interest climbed above $40 billion while Bitcoin traded near cycle highs.
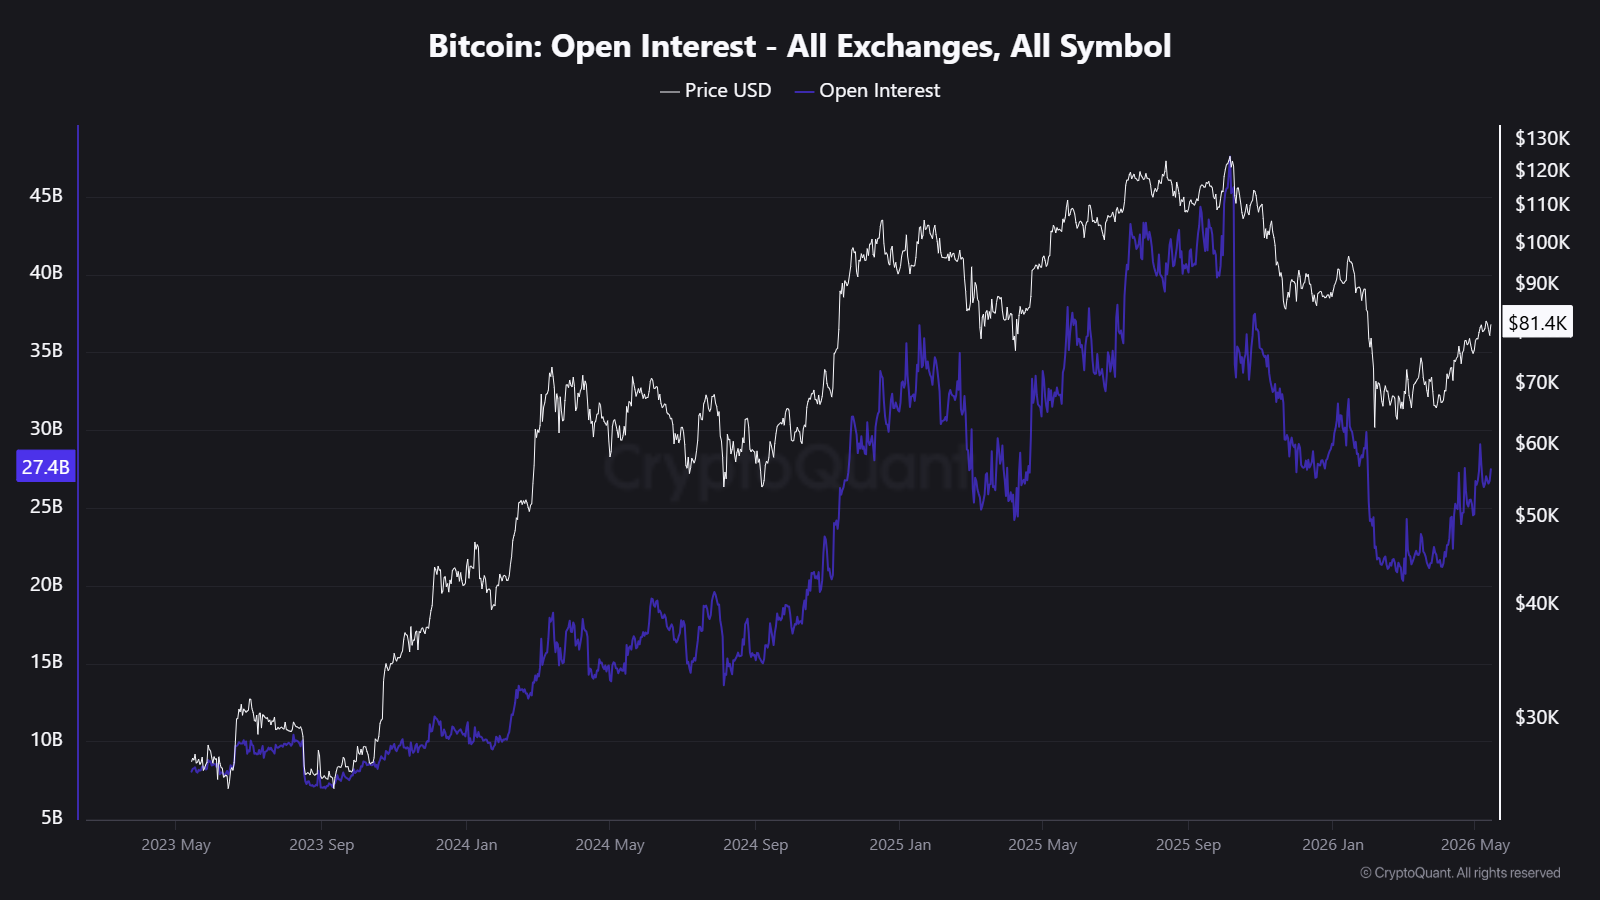
Image Source: CryptoQuant
Rapid growth in open interest, alongside rising prices, usually signals increased speculative participation and stronger market momentum. However, excessive leverage can also make markets vulnerable to liquidation cascades. Meanwhile, declining open interest during corrections often reflects deleveraging events, in which traders either close positions voluntarily or are liquidated.
Bitcoin Dominance and Crypto Market Cycles
Bitcoin dominance has historically served as one of the crypto market’s most important cycle indicators, as it helps track capital rotation between Bitcoin and altcoins. When dominance rises, Bitcoin is outperforming the broader crypto market. This often happens during uncertain or risk-off periods, when investors prefer Bitcoin’s liquidity, stability, and institutional credibility. On the other hand, when dominance falls, capital usually rotates into altcoins as investors chase higher-risk and potentially higher-return opportunities.
Historically, Bitcoin dominance has shifted dramatically across different market cycles:
- Between 2013 and 2016, Bitcoin dominance often stayed above 85% because relatively few alternative cryptocurrencies existed.
- During the 2017 ICO boom, dominance collapsed from around 87% to nearly 31% as speculative capital flooded into Ethereum and smaller digital assets.
- Between 2019 and 2025, dominance generally fluctuated between 45% and 70% as institutional adoption expanded and the broader crypto market matured.
Dominance behavior also tends to follow recurring patterns around Bitcoin halving cycles. During early bull markets, capital usually enters Bitcoin first because institutions and larger investors prioritize liquidity and lower relative risk. Later in the cycle, speculative capital often rotates into Ethereum and altcoins in search of higher returns.
Late-stage euphoric periods frequently coincide with declines in Bitcoin dominance as speculative activity spreads to smaller cryptocurrencies. In contrast, bear markets and macroeconomic uncertainty often trigger a “flight to quality,” causing dominance to rise again as investors move back into Bitcoin.
Bitcoin Scalability Challenges and the Lightning Network
Bitcoin was designed to prioritize decentralization and security. However, those strengths also create scalability limitations. Compared to large payment networks such as Visa or Mastercard, Bitcoin processes far fewer transactions per second. During periods of heavy network activity, congestion can increase, and transaction fees may rise.
To address these limitations, developers and companies created scaling solutions designed to improve Bitcoin’s transaction capacity. One of the most important solutions is the Lightning Network, which was built on top of Bitcoin to enable faster and lower-cost transactions.
Why Bitcoin Has Scalability Problems
Bitcoin blocks have limited space, meaning each block can only contain a certain number of transactions. Since new blocks are produced roughly every ten minutes, Bitcoin processes far fewer transactions than traditional payment networks. During periods of high demand, users compete for limited block space by offering higher transaction fees.
As network congestion increases, confirmation times can slow down, fees may rise, and payments become less efficient. Bitcoin’s design intentionally prioritizes decentralization and security over maximum transaction speed. While larger blocks could increase transaction capacity, running full nodes may become more expensive and difficult, reducing decentralization over time.
Block Size and Network Congestion
As the Bitcoin ecosystem grew, disagreements over how to scale the network became increasingly intense. Some argued that increasing block sizes would allow Bitcoin to process more transactions directly on the main blockchain. Others believed very large blocks could weaken decentralization by making full nodes more expensive to run, limiting participation to users with greater resources. These disagreements eventually led to several network forks, including Bitcoin Cash.
At the same time, network congestion continued to create challenges during periods of heavy activity. When transaction demand surged, users competed for limited block space by paying higher fees to receive faster confirmations. As a result, layer-2 scaling solutions became increasingly important for improving transaction efficiency.
What Is the Lightning Network?
The Lightning Network operates as an L2 payment system built on top of Bitcoin that helps make transactions faster and cheaper. Instead of recording every small payment directly on Bitcoin’s main blockchain, users can open payment channels with one another and transact off-chain. Within these channels, payments can occur almost instantly and incur very low fees. Only the opening and closing of the channel are recorded on the main Bitcoin blockchain, thereby reducing congestion and improving efficiency.
This system helps Bitcoin handle more transactions while making small payments far more practical. As a result, the Lightning Network improves transaction speed, scalability, and overall payment efficiency. Many Bitcoin wallets and payment platforms now integrate Lightning functionality directly, allowing users to send and receive Bitcoin much more quickly than with traditional on-chain transactions.
Advantages and Limitations of Lightning
The Lightning Network helps address several of Bitcoin’s scaling challenges by enabling faster, more efficient transactions outside the main blockchain. With Lightning, payments can settle almost instantly, while users also benefit from much lower fees. Also, the network makes small transactions far more practical. This improved scalability is one reason many developers see Lightning as an important part of Bitcoin’s long-term growth.
Despite these advantages, Lightning also introduces more complexity compared to regular on-chain Bitcoin transactions. Users often need to manage payment channels, keep wallets connected, and rely on sufficient liquidity within the network for payments to route properly. In some cases, payments may fail if routing conditions are unavailable. Although adoption is growing, the Lightning Network is still less understood and less widely used than Bitcoin’s main blockchain. Even so, many developers view Lightning as one of Bitcoin’s most important long-term scaling solutions.
Bitcoin Security, Custody, and Operational Risk
Owning Bitcoin comes with different risks compared to traditional banking systems. While price volatility gets most of the attention, operational mistakes can sometimes create even bigger problems for users.
Unlike bank transfers, which can sometimes be reversed or recovered, Bitcoin transactions become permanent once they are confirmed on the blockchain. As a result, users must keep their private keys and wallet credentials secure. With Bitcoin adoption growing worldwide, wallet security and asset storage have become increasingly important. Many users now focus on securing their wallets, maintaining backups, and following safe storage practices to reduce the risk of theft, hacking, or accidental loss.
Self-Custody vs Exchange Custody
Bitcoin holders usually choose between two main storage methods: self-custody or custodial storage. With self-custody, users control their private keys directly through personal wallets. On the other hand, custodial storage is when a third party, such as a crypto exchange, holds the Bitcoin on the user’s behalf.
Self-custody gives users full ownership and control over their funds because no intermediary can restrict access or manage their wallets. However, this also comes with greater responsibility. If a user loses their seed phrase or private keys, access to the wallet can be lost permanently.
Custodial storage is often more convenient, especially for beginners who may not feel comfortable managing wallet security themselves. Exchanges handle much of the technical side, making Bitcoin easier to access and trade. The downside is that users must trust the platform to remain secure and financially stable. Several major exchange failures and crypto company collapses increased interest in self-custody across the industry, as many users became more aware of the risks involved with relying entirely on third-party platforms.
Common Security Threats
Bitcoin users face several risks beyond market volatility, and many of them come from everyday security mistakes. Because Bitcoin transactions cannot be reversed, even small errors or hacks can sometimes lead to permanent losses. One of the most common threats is phishing. Attackers often create fake websites, emails, or messages that mimic exchanges and wallet providers to steal passwords, seed phrases, or private keys. Malware attacks are also dangerous because infected devices can secretly capture wallet credentials without the user noticing.
Centralized exchanges can introduce additional risk as well. Although many platforms invest heavily in security, exchange hacks and breaches have still affected customer funds over the years. Human error remains another major problem, as sending Bitcoin to the wrong wallet address, losing backup phrases, or exposing sensitive information can permanently lock users out of their funds.
Institutional Custody Models
Institutional Bitcoin custody operates very differently from how most retail users store Bitcoin. Large financial firms and investment funds usually rely on advanced security systems designed to protect massive amounts of capital while reducing operational risk.
Many institutions use multiple layers of protection to secure Bitcoin holdings. These often include multi-signature wallets, offline cold storage systems, geographically distributed backups, insurance coverage, and regulated custodians.
Companies such as Coinbase now provide institutional-grade custody infrastructure for investment funds, corporations, and spot Bitcoin ETFs. Demand for these services increased significantly after the approval of spot Bitcoin ETFs expanded traditional financial participation in the Bitcoin market. As institutional adoption grows, secure custody infrastructure has become a critical part of Bitcoin’s broader integration into global financial systems.
Bitcoin Wallets and Secure Storage
Bitcoin wallets do not actually store coins themselves. Instead, wallets store the private keys that give users access to Bitcoin recorded on the blockchain. Anyone controlling the private keys controls the Bitcoin associated with those addresses. That is why wallet security matters so much. Different wallet types offer different trade-offs between convenience, accessibility, and security.
What Is a Bitcoin Wallet?
A Bitcoin wallet is a tool that helps users interact with the Bitcoin network by managing public and private keys. These wallets can exist as mobile apps, desktop software, web platforms, or physical hardware devices. Public keys are used to generate wallet addresses that people can share to receive Bitcoin. Private keys, however, are far more important because they authorize transactions and prove ownership of the funds connected to a wallet.
When someone sends Bitcoin, the wallet uses the private key to create a digital signature that verifies the transaction is legitimate. This process happens behind the scenes, allowing the network to confirm ownership without revealing the private key itself. Bitcoin itself never physically moves in and out of wallets. The blockchain always stores the transaction history and ownership records. Wallets simply provide access to those records and allow users to authorize transfers securely. Modern wallets often hide much of the technical complexity to make Bitcoin easier to use, but cryptographic keys remain the foundation of Bitcoin ownership and security.
Types of Bitcoin Wallets
Bitcoin wallets are generally divided into two main categories: hot wallets and cold wallets. The difference mainly comes down to whether the wallet, more specifically, the private keys, stay connected to the internet. Hot wallets are connected online and are commonly used through mobile apps, desktop software, web platforms, or crypto exchanges. They are designed for convenience, making them useful for daily payments, active trading, and quick transfers between users and exchanges.
Because hot wallets remain online, they are also more exposed to hacking attempts, malware, phishing attacks, and other security risks. They are convenient, but that convenience usually comes with lower security compared to offline storage. Cold wallets, on the other hand, store private keys offline. Hardware wallets and paper wallets are common examples of cold storage. Since they are disconnected from the internet most of the time, they are much harder for attackers to access remotely.
Wallets can also be classified as custodial or non-custodial. Custodial wallets rely on third parties, such as exchanges, to manage private keys on behalf of users. Non-custodial wallets give users direct control over their private keys, which also means full responsibility for securing and backing them up properly.
How to Set Up a Secure Bitcoin Wallet
Setting up a secure Bitcoin wallet begins with choosing a trusted wallet provider and downloading the wallet only from official sources. Verifying software authenticity is important because fake wallet apps and phishing websites are common methods attackers use to steal funds.
During the setup process, the wallet generates a seed phrase, which is a series of recovery words used to restore access if the device is lost, stolen, or damaged. This seed phrase is one of the most important parts of wallet security because anyone with access to it can control the Bitcoin connected to the wallet.
Because of this, seed phrases should never be shared online, stored in cloud services, sent through email, or photographed carelessly. Many users prefer to write their backup phrase down on paper and store it securely offline. Additional protections such as strong passwords, passphrases, and two-factor authentication can further improve wallet security and reduce the risk of unauthorized access.
How to Acquire and Buy Bitcoin
Bitcoin can be acquired through several different methods. Most users purchase Bitcoin through cryptocurrency exchanges, though peer-to-peer markets and mining also remain available options. Access to Bitcoin became much easier over time as exchanges, payment apps, and financial platforms expanded globally. Still, different acquisition methods entail different trade-offs in privacy, convenience, fees, and custody.
Different Ways to Acquire Bitcoin
Most people buy Bitcoin through centralized exchanges, which allow users to purchase BTC using bank transfers, debit cards, and other payment methods. These platforms are usually the easiest entry point for beginners because they simplify trading, custody, and account management.
Another option is peer-to-peer marketplaces, where buyers and sellers trade directly with each other instead of relying on a traditional exchange to handle the transaction. These platforms can offer more flexibility, although they sometimes require greater caution and technical understanding.
People also acquire Bitcoin in several other ways. Some earn it through mining, while others receive Bitcoin as freelance payments or salaries. Institutional investors and high-net-worth buyers often use over-the-counter trading desks for large purchases, while Bitcoin ATMs provide another way to buy smaller amounts in certain locations.
Different acquisition methods come with different levels of convenience, privacy, accessibility, and operational complexity. For example, institutions often prefer OTC desks because large purchases can be completed with less slippage and reduced impact on public exchange order books.
Best Exchanges to Buy Bitcoin
Several large exchanges now dominate global Bitcoin trading, providing platforms where users can buy, sell, and store digital assets. Over time, different exchanges built reputations based on liquidity, accessibility, trading features, and regional availability.
Binance became one of the world’s largest crypto exchanges by trading volume, offering a wide range of trading products and services. Coinbase gained strong adoption among both retail and institutional investors, particularly in the United States, because of its user-friendly interface and regulatory positioning. Other major exchanges include Kraken, Bybit, and OKX, each serving different types of users and markets.
Picking an exchange often depends on factors such as regional availability, trading fees, liquidity, regulatory compliance, and custody preferences. Security reputation is also extremely important, since users trust these platforms to protect funds and personal information.
Accepted Payment Methods
Most crypto exchanges support multiple payment methods for buying Bitcoin, offering users options based on speed, convenience, and regional availability.
Bank transfers are commonly used because they usually offer lower fees, although deposits can take longer to process. Debit and credit card purchases often provide much faster access to Bitcoin, but they may come with higher transaction costs.
Many platforms also support mobile payment systems, PayPal, local banking networks, and stablecoin conversions, making Bitcoin more accessible to users across different regions and financial systems.
Payment availability often depends heavily on local regulations and banking relationships. In some countries, exchanges are well integrated with traditional financial systems, while in others, stricter regulations or banking restrictions can make onboarding and deposits more difficult.
Step-by-Step Bitcoin Purchase Process
Buying Bitcoin through an exchange is usually a straightforward process, especially for beginners entering the market for the first time. Most exchanges simplify the process by guiding users through account setup, verification, funding, and trading.
The process generally works like this:
- First, create an account on a cryptocurrency exchange
- Then, complete identity verification requirements
- Proceed to deposit funds using a supported payment method
- Afterwards, place a market or limit order to buy Bitcoin
- Finally, store the Bitcoin on the exchange or transfer it to a personal wallet
Peer-to-Peer and OTC Bitcoin Purchases
Not all Bitcoin transactions happen through traditional exchanges. Some users prefer peer-to-peer platforms, which connect buyers and sellers directly without relying on a centralized marketplace to complete trades.
These platforms can offer greater privacy, more flexible local payment methods, and alternative settlement options depending on the region and participants involved. In some countries, peer-to-peer trading has become especially popular where access to major exchanges or banking services is limited.
Because users trade directly with one another, caution is extremely important. Fraudulent counterparties, fake payment confirmations, and scams can exist, which is why many platforms use escrow systems and reputation scores to improve trust between participants.
Over-the-counter, or OTC, trading serves a different part of the market. OTC desks help institutions and large investors buy or sell significant amounts of Bitcoin privately outside public exchanges. This reduces slippage and minimizes the impact large orders could have on exchange order books. As institutional participation in Bitcoin expanded, OTC activity became increasingly important because major investors needed more efficient ways to execute large trades without causing sudden price disruptions in public markets.
Bitcoin as a Payment System and Global Adoption
Bitcoin originally aimed to function as peer-to-peer electronic cash. While many investors now treat Bitcoin as a financial asset, payment usage still remains an important part of the network. Global adoption expanded gradually across businesses, payment providers, and even governments. Still, Bitcoin faces challenges that limit broader everyday payment usage compared to traditional systems.
How Bitcoin Payments Work
Bitcoin payments allow value to move directly between wallet addresses through blockchain transactions. Instead of relying on banks or payment companies to process transfers, the Bitcoin network verifies and records transactions independently. When someone sends Bitcoin, their wallet digitally signs the transaction using a private key to prove ownership of the funds. Network nodes then verify the transaction before miners include it inside a new block on the blockchain.
One of Bitcoin’s biggest differences from traditional payment systems is that transfers can happen globally without banking hours, geographic restrictions, or centralized intermediaries. As long as users have internet access and a Bitcoin wallet, payments can be sent and received almost anywhere in the world.
The Lightning Network also improved Bitcoin payments by enabling faster, lower-cost transactions for smaller amounts. This made everyday payments more practical in certain situations, especially where quick settlement and lower fees are important.
Businesses That Accept Bitcoin
Over the years, a growing number of businesses and online platforms have begun accepting Bitcoin as a payment method. Adoption gradually expanded across industries such as technology, travel, gaming, and e-commerce as more companies explored digital asset payments.
Payment processors played an important role in this growth by helping merchants accept Bitcoin without needing deep technical knowledge. Many of these services allow businesses to receive Bitcoin from customers while automatically converting the funds into local currencies, reducing concerns about price volatility. Some companies choose to keep the Bitcoin they receive as part of their treasury holdings, while others convert payments into fiat currencies immediately to maintain more stable cash flow and reduce market risk.
At the moment, Bitcoin merchant adoption remains much smaller than traditional payment systems such as credit cards and online banking networks. Even so, the infrastructure supporting Bitcoin payments continues expanding steadily as technology and regulatory clarity improve.
Challenges Limiting Bitcoin Payments
Despite growing awareness and adoption, several factors still limit Bitcoin’s use as an everyday payment method. One of the biggest challenges is price volatility. Large short-term price swings can make both merchants and consumers hesitant to use Bitcoin for regular purchases and payments.
Network congestion can also become an issue during periods of heavy activity. When transaction demand rises sharply, confirmation times may slow down, and transaction fees can increase, reducing efficiency for smaller everyday payments. Another reason adoption remains limited is that many people view Bitcoin primarily as a long-term investment or store of value rather than money meant for daily spending. As a result, users often prefer to hold their Bitcoin rather than use it for purchases.
Bitcoin also competes with traditional payment systems, stablecoins, and modern fintech applications that already offer fast and convenient digital payments with lower volatility. Despite these limitations, Bitcoin still functions as a global decentralized payment network that operates across borders and financial systems without relying on central authorities or banking infrastructure.
Bitcoin Trading and Market Participation
Bitcoin has become one of the largest trading segments in the crypto market, with millions of people actively trading daily across spot markets, derivatives exchanges, and financial desks around the world. With wide adoption, Bitcoin emerged as a global market with no closing times.
Unlike conventional stock exchanges, which close after trading sessions end, Bitcoin trades in global markets 24 hours a day. This continuous nature means that it is possible for traders in any location at any time to participate. However, it also means that volatile conditions can arise, in which major price swings can occur overnight, over the weekend or immediately after major macroeconomic developments.
Some traders focus on short-term volatility, while others approach Bitcoin as a long-term investment. The methods employed depend on one’s experience, risk tolerance and investment goals. Bitcoin trading has come a long way since the days of early cryptocurrency enthusiasts. In fact, it is now a highly liquid and global market that includes spot ETF issuers, proprietary trading firms, institutional investors, and hedge funds.
Bitcoin trading is the act of buying and selling Bitcoin to gain profits from market price fluctuations. The first Bitcoin trading activity began soon after the asset was created. The Bitcoin Market was launched in February 2010 as one of the first Bitcoin exchanges to offer Bitcoin for fiat currency. At the time, Bitcoin traded for less than a cent.
One of the most celebrated early transactions took place on May 22, 2010, when programmer Laszlo Hanyecz paid 10,000 BTC for two pizzas, which was later dubbed “Bitcoin Pizza Day.” In reality, the coins were worth less than $50 combined. Years later, that initial transaction became a symbol of Bitcoin’s stunning price appreciation and expanding market value.
The coin first reached parity with the U.S. dollar in 2011, which marks one of the earliest psychological milestones in the market’s recent history. With the spread of awareness, the trading activity grew quickly. The 2017 bull market brought Bitcoin to the attention of the mainstream retail audience, as prices moved in a single year from about $1,000 to almost $20,000. Institutional participation further accelerated from 2021 to 2024 as futures ETFs, spot ETFs, and large corporate treasury adoption pushed larger capital flows into the business.
How Bitcoin Trading Works
Generally, Bitcoin trading occurs in digital markets where buyers and sellers trade Bitcoin for fiat or other crypto assets according to supply and demand. Prices are constantly changing as traders respond to macroeconomic disease, liquidity conditions, institutional flows, regulatory announcements and overall investor sentiment.
There are two main types of Bitcoin trading; spot and derivatives. Spot trading refers to purchasing actual Bitcoin. When you buy BTC on the spot market, you own the underlying asset – you can hold on to it, send it to someone else, or sell it. Spot trading is more popular among long-term investors who want to hold Bitcoin for many years, given its full potential for long-term adoption and price appreciation.
Derivatives trading, however, allows traders to speculate on Bitcoin’s price performance in the future without owning that Bitcoin directly. Futures and perpetual contracts were especially popular because they allow traders to profit from both price increases and price decreases in the underlying asset.
Perpetual contracts in particular have become one of the most popular products in cryptocurrency markets because they don’t have an expiry date like traditional futures contracts. They simply allow a trader to keep a position in a contract open for as long as they’re able to pay the margin. Funding rate systems have been introduced to ensure that the price of perpetual contracts stays in line with the spot market.
Furthermore, leverage is another factor that many derivatives traders typically incorporate into their trading strategy. While leverage allows traders to control large positions with a relatively small amount of capital, it also considerably increases the risk exposure. In highly volatile market conditions, excessive use of leverage can cause rapid liquidations when the exchange automatically closes a losing position as soon as the collateral is less than the maintenance margin.
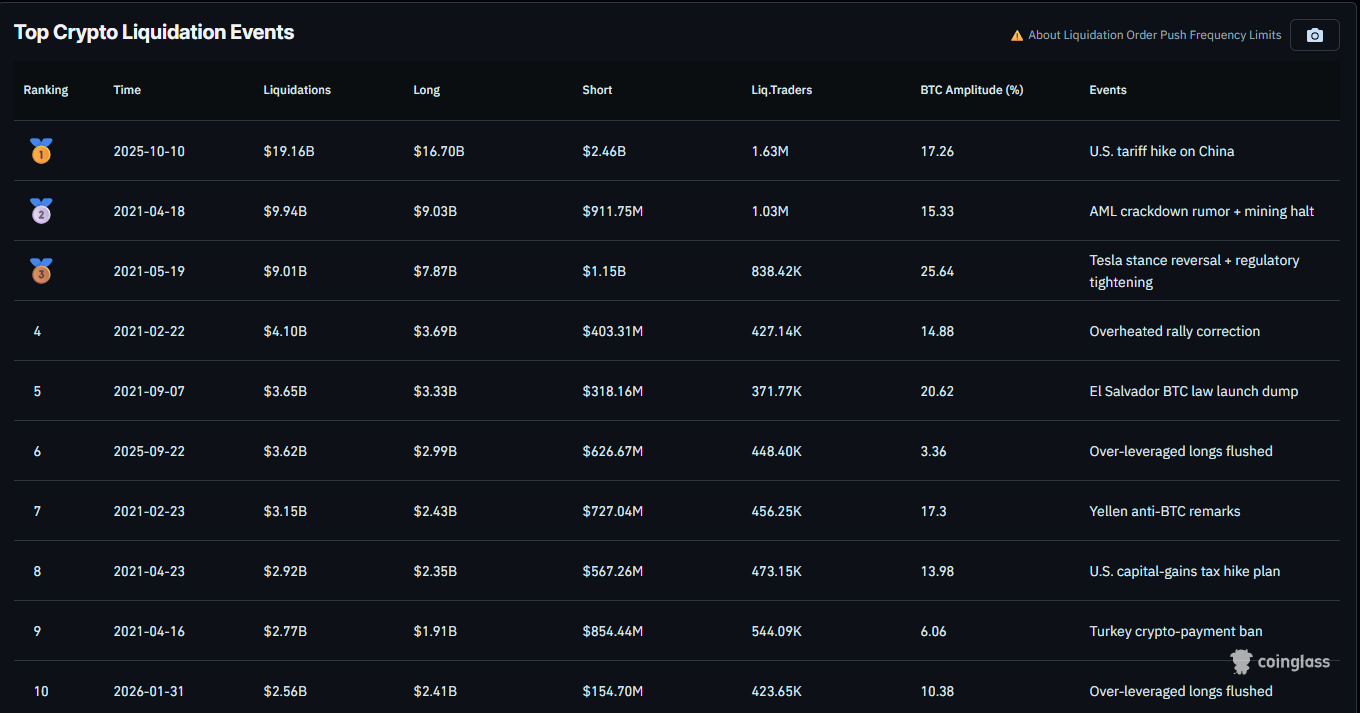
Image Source: Coinglass
Large liquidation events became a defining feature of Bitcoin markets over time. During periods of heightened volatility, cascading liquidations can amplify price swings as forced buying or selling rapidly pushes prices higher or lower within short periods.
Short-Term and Long-Term Bitcoin Trading
Trading approaches vary widely across the market depending on experience, risk tolerance, and investment objectives. Short-term trading focuses on profiting from relatively small price movements over shorter timeframes. Day traders may open and close multiple positions within a single session, while scalpers attempt to capture extremely small market movements over minutes or even seconds. Swing traders often hold positions for several days or weeks as they attempt to profit from broader market trends and momentum shifts.
Bitcoin’s volatility makes short-term trading attractive to many participants because rapid price fluctuations can create frequent trading opportunities. However, that same volatility also increases the probability of large losses, especially when leverage is involved.
Long-term investors typically focus less on daily volatility and more on Bitcoin’s broader adoption cycle, scarcity model, institutional demand and macroeconomic positioning. Rather than attemptingto trade everyshort-term market movement, long-term participants often hold Bitcoin over multiple years while tolerating periods of extreme volatility and market drawdowns.
Historically, Bitcoin experienced multiple major boom-and-bust cycles. The market suffered deep declines following the 2013 rally, the 2017 bull market and the 2021 cycle peak. Despite those large corrections, long-term investors often continued focusing on Bitcoin’s expanding global adoption, increasing institutional participation, and fixed supply structure.
Common Bitcoin Trading Styles
Bitcoin traders use different trading styles depending on their strategies, time horizons, and risk preferences. Scalping focuses on extremely short-term market movements where traders attempt to profit from small price changes repeatedly throughout the day. This strategy usually requires fast execution and constant market monitoring.
Day trading involves opening and closing trades within the same trading day to avoid overnight exposure. Many day traders rely heavily on technical analysis, momentum shifts and intraday volatility. Swing trading focuses on capturing medium-term market movements that can last several days or weeks. Traders often combine technical analysis with macroeconomic developments and broader market sentiment.
Position trading takes a longer-term approach, in which traders hold positions over extended periods while following major market trends. Some participants also approach Bitcoin primarily as an investment rather than an active trading vehicle. These investors often focus on long-term accumulation strategies rather than short-term speculation.
Institutional participation expanded significantly over time as hedge funds, proprietary trading firms, asset managers, and spot ETF issuers entered Bitcoin markets. This institutional involvement introduced larger capital flows, more sophisticated trading strategies and greater integration between cryptocurrency markets and traditional financial systems.
Risk Management and Trading Psychology
Successful Bitcoin trading requires much more than predicting price direction. Discipline and risk management are often what separate consistent traders from those who struggle during volatile market conditions. Bitcoin remains significantly more volatile than most traditional financial assets. Sharp price swings can occur within minutes during major economic announcements, derivatives liquidations, geopolitical events or sudden shifts in market sentiment. Because of this, experienced traders often focus heavily on position sizing, stop-loss management, liquidity conditions, and emotional discipline before entering trades.
Emotional decision-making remains one of the biggest risks in highly volatile markets. During strong rallies, greed can push traders toward excessive leverage or oversized positions. During sharp corrections, fear often causes panic selling near local bottoms.
Market cycles repeatedly demonstrate how investor psychology influences Bitcoin trading activity. During bull markets, optimism and momentum often attract aggressive speculation. But for bear markets, fear and uncertainty frequently dominate market behavior as prices decline and leverage is flushed from the system.
Experienced market participants often prioritize protecting capital and limiting downside risk rather than aggressively chasing every short-term opportunity. Over long periods, avoiding catastrophic losses can become just as important as generating profits.
Technical Analysis Basics
Basically, technical analysis examines price action, trading activity, and historical market behavior to identify potential trading opportunities. Technical analysis is less about accurately predicting markets and more about assessing probabilities, managing trades and helping traders make decisions under uncertainty.
Bitcoin traders often look at the following:
- support and resistance levels
- trend structure
- moving averages
- RSI indicators
- volume behavior
- market momentum
- liquidation zones
Looking at the above, support levels indicate price areas where buying activity may appear and resistance where selling pressure may pick up. Moving averages are used as a way to gauge overall market trends and changes in market momentum. Relative Strength Index (RSI) indicator is also another key market tool that attempts to gauge potential overbought or oversold conditions in Bitcoin over particular time periods. Volume analysis is also an important element, as it is often considered that strong volatility accompanied by high volume is more reliable than volatility accompanied by low volume.
Technical analysis as it is known today has its roots in Charles Dow’s Late 1800s Dow Theory, which later evolved into broader market concepts such as chart patterns, momentum indicators and statistical analysis of markets. Bitcoin traders have emulated many of these old market concepts in the cryptocurrency markets over time.
Technical setups can be quickly broken by major macro events, sudden changes in liquidity or large-scale underwater derivatives that change the market landscape. For this reason, many traders combine technical analysis with macro analysis, liquidity and risk management rather than looking only at chart signals.
Bitcoin Forks and Fork-Based Cryptocurrencies
Bitcoin’s open-source design allows developers to modify its codebase. When disagreements emerge over upgrades, scalability or network rules, blockchains can split into separate versions called forks. Forks became one of the most important governance mechanisms within cryptocurrency networks because Bitcoin has no central authority making final decisions. Some forks create only temporary software updates while others create entirely new cryptocurrencies with separate blockchains and communities.
What Is a Bitcoin Fork?
A fork in Bitcoin refers to modifications made to the network’s protocol rules. As Bitcoin runs on a network of thousands of nodes spread worldwide, all software releases rely on global consensus. When discrepancies happen to the extent that consensus cannot be reached, the chain also splits into two chains.
A fork may occur for many reasons, such as technical updates, security, governance, scaling, and ideological differences about the future of Bitcoin. Some forks are compatible with the original Bitcoin blockchain and remain valid participants on the network under the same rules. Others, however, are completely broken away into independent cryptocurrencies, with their own separate communities, developers and market value. The proliferation of Bitcoin forks is connected to the growth of Bitcoin itself and the prior alienation between groups that had divergent ideas on how the blockchain should eventually scale.
Hard Forks vs Soft Forks
Bitcoin’s software can change over time through upgrades known as forks. These upgrades modify network rules and help introduce new features, security improvements, or scalability changes. Soft forks are backward-compatible upgrades, meaning older nodes can still recognize new blocks as valid even if they do not upgrade immediately. That means, for a long time, most of the network can keep using the new blocks without breaking. This makes soft fork upgrades less disruptive. They help the older parts of the network keep working with newer parts.
Hard forks are upgrades that make the network rules incompatible with the previous ones. If a portion of the network doesn’t upgrade, the blockchain can permanently split into two. And that can result in new cryptocurrency because both chains exist simultaneously.
Soft forks usually aim to avoid such disruptive effects. Among some of the most notable hard forks are SegWit—short for Segregated Witness. SegWit is a soft fork that makes transactions more efficient and second-layer scaling solutions possible.
Bitcoin Cash and Scaling Debates
Much of Bitcoin’s history has been defined by a single debate: how to scale Bitcoin. As Bitcoin adoption grew, the network began to experience congestion, leading to slow confirmations and high fees. Some in the community thought Bitcoin could only grow as fast as the block size limit. So, they argued that Bitcoin should allow for much larger blocks to process more transactions on the base layer. Others contended that doing so too aggressively would hurt Bitcoin’s decentralization by raising the costs of running full nodes.
The debate grew increasingly heated as transaction volumes swelled. On one side were proponents of larger blocks who wanted to keep Bitcoin focused on being a fast and cheap payment system. On the other hand, critics argued that very large block sizes were a gradual means of eroding decentralization by allowing a small group of powerful miners to control most of the network. The argument culminated in a hard fork that year, in 2017, creating Bitcoin Cash. The forked chain’s new block size limits were far larger than the original chain’s.
The Bitcoin Cash hard fork has become a real-world illustration of what decentralized governance looks like. With no single authority to finalize proposals, important disagreements within the community can, at times, result in two competing networks with distinct philosophies and technical visions.
Major Cryptocurrencies Created from Bitcoin Forks
Several new cryptocurrencies were forked from Bitcoin or adopted Bitcoin’s code with a different governance model. These altcoins emerged as developers and community stakeholders held differing opinions about Bitcoin’s scalability and governance. Bitcoin Cash was one of the most well-known forks of Bitcoin, which split from the main chain during the block size debate of 2017. Later disagreements within the Bitcoin Cash community led to another fork that created Bitcoin SV.
Another cryptocurrency is Litecoin, which was forked from Bitcoin in 2011 by copying Bitcoin’s code. Litecoin has some features similar to Bitcoin, but also some differences, such as a different mining algorithm that they hoped would benefit users with new features. Bitcoin’s chain, code, infrastructure and user community have spread across the cryptocurrency network and are adopted by several new blockchain networks. Bitcoin is the most widely adopted and most secure Proof-of-Work cryptocurrency, but several new solutions have been proposed, each with different versions of open-source blockchain technology and economic models.
Latest Bitcoin Market Updates
Earlier in June, Bitcoin slipped below $60,000, falling to around $59,357 on Bitstamp as traders closely watch key support levels. Deribit noted that roughly $1.2 billion in options open interest is concentrated around the $60,000 strike, making it an important price zone. Market participants are also monitoring Bitcoin’s 200-week moving average for support, while weak momentum continues to weigh on hopes for a near-term bullish breakout.
Institutional activity also remained a major focus across the market. Reports showed that BlackRock sold roughly $61.5 million worth of Bitcoin while its tracked on-chain portfolio remained near $69.66 billion in value, with Bitcoin and Ethereum still representing the largest visible holdings.
Regulation also stayed at the center of crypto discussions in the United States. Ripple Chief Legal Officer Stuart Alderoty publicly supported the proposed CLARITY Act, arguing that clearer crypto regulations are necessary to protect the estimated 67 million Americans who already hold digital assets. Meanwhile, crypto entrepreneur Arthur Hayes pushed back strongly against the proposal, urging President Donald Trump to veto the legislation and maintain a less regulated crypto environment.
Outside the market itself, cybersecurity concerns also drew attention after GitHub confirmed that a poisoned VS Code extension compromised an internal employee device and potentially exposed around 3,800 repositories. The malicious extension version was reportedly removed quickly after detection, while GitHub isolated the affected endpoint and began incident response procedures immediately.
Frequently Asked Questions About Bitcoin
What usually moves the Bitcoin price?
Bitcoin’s price reacts to several factors simultaneously. Spot demand, ETF inflows, derivatives positioning, macroeconomic conditions, liquidity levels, and investor sentiment all influence market behavior.
Is Bitcoin affected by Federal Reserve policy?
Yes. Federal Reserve policy strongly affects Bitcoin markets today. Lower interest rates and expanding liquidity often support risk assets, including Bitcoin. Higher rates and tighter liquidity conditions usually pressure speculative markets.
What is BTC dominance?
BTC dominance measures Bitcoin’s share of the total cryptocurrency market capitalization. Rising dominance often signals stronger Bitcoin performance relative to altcoins. Meanwhile, declining dominance may indicate increased speculative activity among smaller cryptocurrencies.
Are ETF inflows enough to sustain rallies?
ETF inflows became a major source of Bitcoin demand, especially after spot ETF approvals. Still, ETF flows alone do not control market direction permanently. Broader liquidity conditions, macroeconomic trends, leverage positioning, and investor sentiment also matter heavily.
What is the biggest risk for Bitcoin holders?
Bitcoin holders face several risks. Price volatility remains significant, especially during periods of leverage-driven speculation or macroeconomic uncertainty.
Operational risks also matter heavily. Losing private keys, falling for phishing scams, or storing assets insecurely can result in permanent losses. Regulatory uncertainty also continues affecting parts of the industry.
How does Bitcoin mining work?
Bitcoin mining secures the network through Proof-of-Work calculations. Miners use specialized hardware to compete for block validation rights. Successful miners receive newly issued Bitcoin and transaction fees as rewards. Mining also helps maintain decentralized consensus across the network.
Why does liquidity matter in Bitcoin markets?
Liquidity affects how easily Bitcoin can be bought or sold without causing major price movement. Strong liquidity generally creates more stable market conditions. Thin liquidity can produce aggressive volatility and sharp price swings. Liquidity conditions also influence slippage, derivatives activity, and liquidation behavior.
What is the difference between spot and derivatives markets?
Spot markets involve direct ownership of Bitcoin through buying and selling actual BTC. Derivatives markets allow traders to speculate on Bitcoin’s price using contracts such as futures and perpetual swaps without owning Bitcoin directly.
Explore more
A Brief Introduction to Bitcoin Wallets & Security
AI & Meme Token Presales: How to Read Hype, Fair Launches, and “Best Meme Coin” Searches
Altcoins Explained: Altcoin Season, News, and the Full Coin Map
Bitcoin Basics: Bitcoin ETF, Institutional & Corporate Adoption
Bitcoin Basics: Bitcoin Investing & Valuation
Bitcoin Basics: Bitcoin Mining & Supply Economics