
 Samuel·3d ago
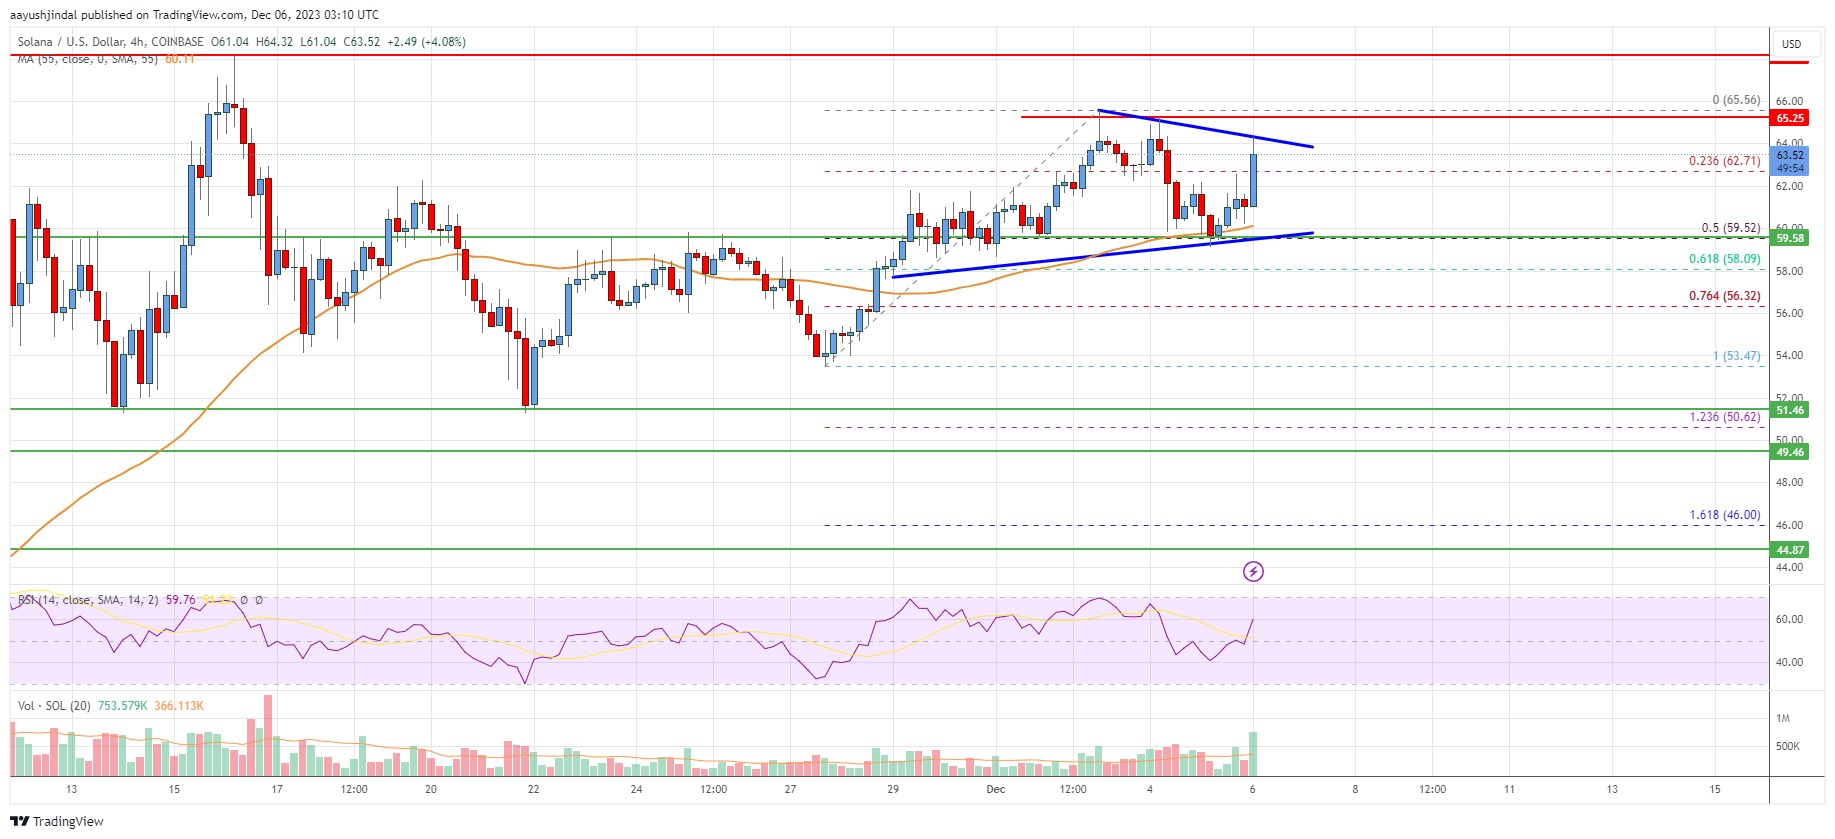
Solana price is trading above $60 against the US Dollar, like Bitcoin. SOL is consolidating gains and might start a fresh increase above $65.
SOL price attempted more upsides above the $60.00 resistance zone. The price climbed above the $62.00 zone, but the bears were active near the $65.00 zone.
A high was formed near $65.56 before there was a downside correction. The price declined below the $63.20 support zone. The bears were able to push the price below the 23.6% Fib retracement level of the upward wave from the $53.47 swing low to the $65.56 high.
It is now trading above $60.00 and the 55 simple moving average (4 hours). On the downside, initial support is near the $61.50 level. The next major support is near the $60.00 and $59.50 levels.
There is also a key contracting triangle forming with support near $59.50 on the 4-hour chart of the SOL/USD pair. It is close to the 50% Fib retracement level of the upward wave from the $53.47 swing low to the $65.56 high. A downside break below the $59.50 support level might spark a sharp decline.
In the stated case, the price may perhaps decline toward the $55.00 level. Any more losses might call for a test of $50.00. On the upside, immediate resistance is near the $64.00 level.
The next major resistance is near the $65.00 zone. Any more gains might send SOL price toward the $68.50 resistance zone, above which the price could accelerate higher. The next major resistance sits near the $75.00 level.
Looking at the chart, Solana price is clearly trading above $60 and the 55 simple moving average (4 hours). Overall, the price must stay above the $60.00 and $59.50 support levels to start another increase.
4 hours MACD – The MACD is now gaining momentum in the bullish zone.
4 hours RSI (Relative Strength Index) – The RSI is now above the 50 level.
Key Support Levels – $62.00 and $60.00.
Key Resistance Levels – $64.00, $65.00, and $70.00.
Related News
Explore more