
 Peter Mwenda·9hr ago

SUI trades near $1.06 support as the 1H chart shows a bullish megaphone setup, with $1.31 and $1.73 as upside levels.
SUI bulls are defending the $1.06 level as price action tests a key support and resistance zone.
The level also aligns with the 0.618 Fibonacci retracement from the recent swing low to high.
The setup has drawn attention because SUI remains near a possible breakout area. Market data shows price trading near $1.09 after a recent pullback from higher levels.
The one-hour SUI chart shows a developing bullish megaphone pattern. This pattern has wider price swings, and it often shows rising market tension.
Traders are watching the upper and lower trendlines for confirmation. The $1.06 level remains central to the current setup.
The area sits near the EMA21 and EMA50, while the EMA200 is near $1.078. Price remains close to these moving averages, but it has not yet cleared them with strength.
We're seeing a $SUI 1H bullish megaphone pattern emerge 🚀
The $1.06 level is a key resistance and support zone, aligning with the Fibonacci .618 level of the last swing low-high, and price has failed to break through it, indicating a potential trading opportunity. 🫡
This… https://t.co/6zQYi7QpQ8 pic.twitter.com/1TkBM5TKXJ
— Sui Media💧 (@media_sui) May 25, 2026
SUI recently rejected near the $1.13 to $1.15 region. It then dropped toward the lower channel area and formed a local low near $0.9832.
The rebound from that low has brought price back toward the $1.06 to $1.08 area.
A market analysis stated that “the $1.06 level is a key resistance and support zone.” The same view noted that price has failed to break through the zone with clear force.
Related Reading: SUI Sentiment Shifts As Price Nears $1 And Buyers Watch Key Levels
The short-term chart remains mixed. Price is still below the EMA200, which keeps the one-hour structure under pressure.
However, the defense of the $1.04 to $1.06 area has kept buyers active. A clean move above $1.08 would improve the short-term setup.
That level sits near the EMA200 and prior consolidation. A hold above it could open a move toward $1.10, then $1.13.
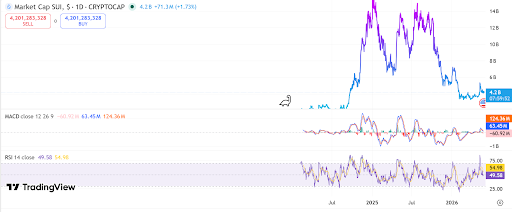
The MACD on the one-hour chart remains weak. The MACD line is close to the signal line, and momentum looks flat.
This shows that buyers still need stronger volume and follow-through. Support sits near $1.04 to $1.045.
A break below that area could bring another test of $1.00. A daily or hourly breakdown under $0.9832 would weaken the current rebound structure.
The daily SUI chart shows a broader base between $0.90 and $1.10. Price broke above that range earlier and moved toward $1.30 to $1.40.
It later pulled back into the same zone. This creates a retest of former resistance as support. The red demand zone on the chart sits between $0.96 and $1.08.
The 0.618 Fibonacci level is near $1.06, while the 0.786 level is near $0.96. A daily hold above $1.05 to $1.06 would support the bullish retest view.
A wick into $0.96 to $1.00 may still fit the structure. However, a daily close below $0.96 would weaken the breakout case.
$SUI just swept the lows and tapped support, setting the stage for a potential rebound 🚀
We're seeing a classic pattern play out here, where the price tests the support level and then bounces back – this is usually where the fun begins, as investors start to gain confidence in… https://t.co/wJSic2u79k pic.twitter.com/kr1vnw0cyF
— Sui Media💧 (@media_sui) May 24, 2026
Resistance remains near $1.17 to $1.31. A daily close above $1.31 would confirm stronger upside momentum.
The next target sits near the 1.618 Fibonacci extension around $1.68. The chart also marks a horizontal level near $1.73.
This zone remains the main upside target for bulls. A break above $1.73 could place the $2.09 extension back on watch.
SUI market cap also remains near $4.20 billion. The broader market cap chart shows support around $3.5 billion to $4.0 billion.
Resistance remains near $4.8 billion to $5.2 billion. A reclaim of that area would support the recovery structure.
Related News
Explore more