
 Samuel·1d ago

Bitcoin’s weekly candles now sit above a stack of moving averages, and the upper edge of that band near $78K is where this breakout gets tested. Not advice.
Bitcoin was changing hands near $83,978 at 09:00 UTC on Saturday, September 26, and the weekly chart doesn’t look like it did a month back. Price has climbed on top of a stack of moving averages that spent most of the year leaning on it.
Good news, sure. Not the whole story, though.
Weekly EMAs on Binance BTCUSDT candles are pretty plain about it. The 50, 55 and 100-week lines bunch up somewhere between $77.8K and $78.6K, with the 21-week around $73.7K. Faster lines are still creeping toward the slower ones. The 8-week, near $77K, hasn’t crossed yet.
On the TradingView weekly, the coloured band slopes down through winter and spring, then flattens as candles push through it in August. The week of August 17 did the heavy lifting. Bitcoin opened it near $62,900 and closed at $77,734.
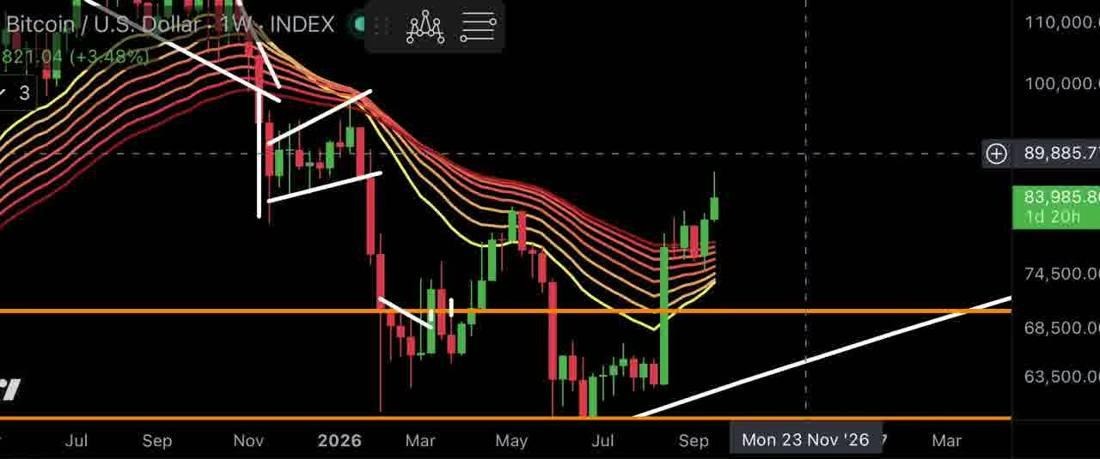
Source: TradingView BTCUSD weekly index chart, moving-average ribbon with price above its upper edge
It’s already been tested once, too. The week of September 7 closed at $76,842, under the cluster, before the next weekly candle finished at $81,178. That’s a retest that held, at least for now.
Chart watchers usually want the faster averages to cross above the slower ones before calling a bear phase over. Not there yet.
Price is about 7% above that band. Bitcoin’s median daily range has been 2.5% over the last 30 days, and the 14-day ATR is close to $2,459. Sliding to the band’s top edge would take a bit over two average daily swings, which, yeah, isn’t a stretch. It isn’t a forecast either.
Some traders expect a return to the upper edge before any longer run. Others figure price just keeps going. The chart doesn’t settle it. A weekly close back under $78,000 would, though, put the whole breakout in doubt.
Closer in, there’s a ladder under price. Binance data put the prior-week high at $81,933.90, and August’s monthly high at $81,500. Then come swing highs from September 11 and 14, $79,859.80 and $79,570.90, with the month’s open at $78,549.60 just below them.
Bitget said unauthorized transfers began from its hot wallets on September 24, first put at $351.6 million and later raised to $387.5 million. LBN’s report has the details. Bitcoin’s 24-hour change is roughly flat at -0.1%, with no sign the shock dragged it lower.
Say buyers get another push. What they’d want to see is a one-hour close above $84,296.60, which marks today’s high to this point. That opens $85,224 and, after it, $87,385.10, September’s high. Should price slip back under $83,875 on a one-hour close, forget that version.
Sellers have a route too, and it’s shorter to write than to trade. Lose $83,750 on a one-hour close and $83,130.10 comes into play, then $82,832. If a one-hour candle finishes back over $84,168.75 first, that idea’s off the table. Zoom out and the backdrop still leans constructive, honestly. Bitcoin’s above a rising 100-day average near $69,500, roughly 3.9% under its 20-day high and stuck in its recent range. More on all that in the Bitcoin hub.
None of this is financial or investment advice. It’s news and chart commentary only.
Related News
Explore more