
SGX Wins CFTC Approval for Bitcoin, Ethereum Futures: What’s Next for Prices?
 Samuel·5d ago

Ethereum swept liquidity above $2,600, then broke market structure lower once the CLARITY Act vote failed, and price is now sitting right back inside that trap.
Ether traders who bought the September 11 spike to $2,660 are underwater today. That candle looked like the start of something. It wasn’t.
The token has slid back toward $2,410, and the chart tells a specific kind of story. Price swept liquidity above a month-long trading range, reversed hard, then broke structure lower right as the U.S. Senate’s CLARITY Act cloture vote failed 49 to 50 on Tuesday. Bitcoin dropped through $76,000 in the same stretch, and the wider market took a long-liquidation flush worth roughly $660 million, according to CoinGlass data, with longs making up 84% of it.
Zoom into the four-hour chart and the setup is almost clean enough to use as a teaching example. Ether launched off a base near $1,900 in mid-August, ran into resistance around $2,600, and chopped there for weeks while buy-side liquidity built up above the range. The push through that level on September 11 wasn’t strength. It swept the resting stops and reversed within hours.
That’s a stop hunt, not a breakout.
What followed was a break in market structure, the point where price closes below the prior swing low and flips the whole range bearish. Ether did that on September 15, tumbling through $2,350 to $2,400 alongside the broader selloff tied to “Bitcoin’s Drop Looks Like 2022 All Over Again”. Price has since drifted back up into the zone where that break happened, the kind of retest traders watching order blocks treat as a low-risk spot to sell into, not buy.
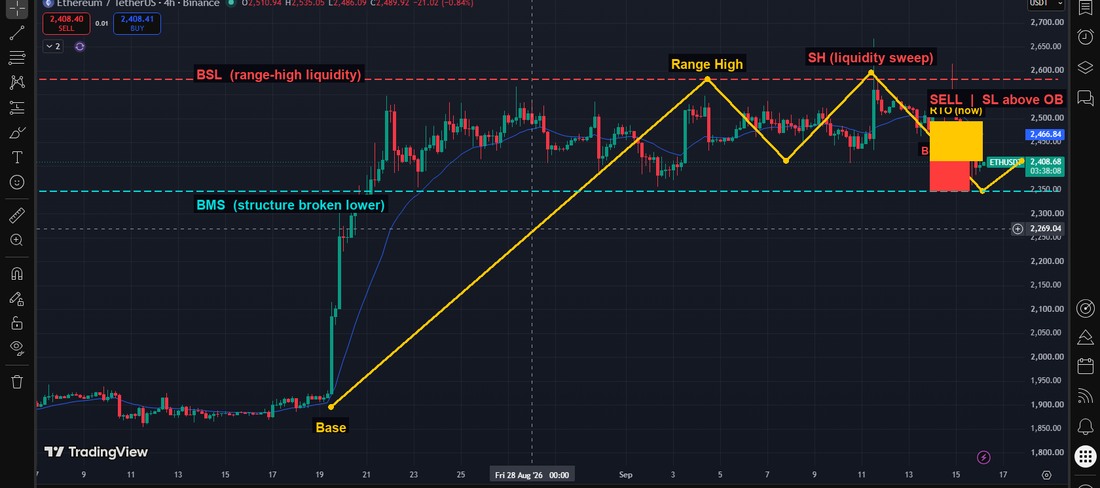
ETH/USDT, 4-hour chart. Source: TradingView.
Here’s the part that actually matters for what happens next. Open interest across ETH futures sits near $31.4 billion, down about 3.1% in a day, and funding rates on Binance, OKX, Bybit and Bitget have all reset close to flat. That’s a market getting cleaned out of over-leveraged longs, not one where fresh shorts are piling in with conviction. A one-sided flush like that usually leaves room for a bounce, even inside a bearish structure.
It just hasn’t happened yet.
The dollar isn’t fighting back hard either. The DXY sits near 99, off its August high above 101.6, which would normally give risk assets some room to breathe. It just hasn’t been enough to outweigh the liquidity story playing out above current price.
Step back to the weekly chart and Ether is trading well under the resting liquidity from its 2025 cycle high near $4,965, a level it hasn’t traded back through since topping there. The recovery off the correction low around $1,470 to $1,550 is still technically alive. It just hasn’t produced a bullish break of structure back above that ceiling.
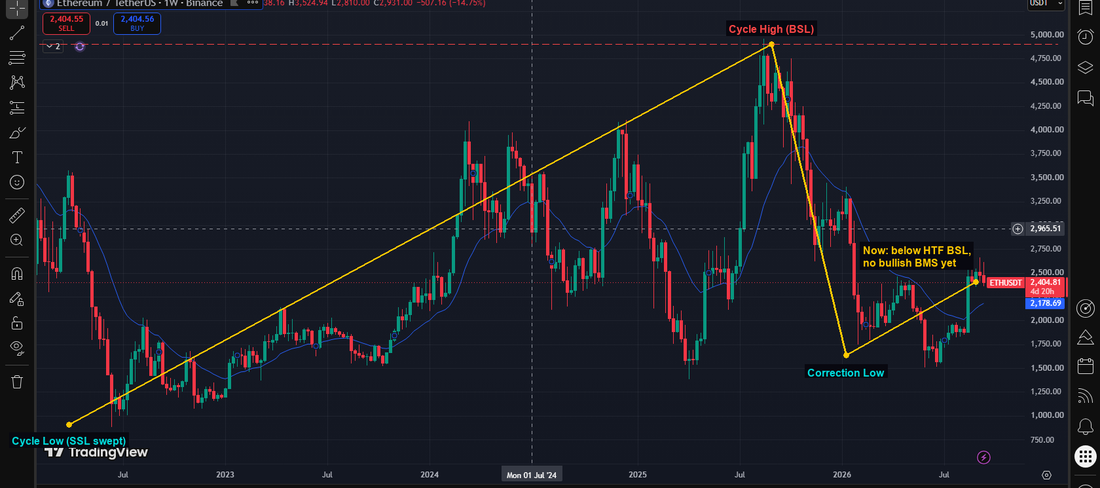
ETH/USDT, weekly chart. Source: TradingView.
For now the reclaim level to watch sits around $2,600, the same zone that got swept before the drop. Losing $2,350 again opens the door toward $2,000. None of this is investment advice, just a read of where Ethereum price is sitting relative to the levels that actually moved it this week.
Samuel·5d ago
 Peter Mwenda·August 15, 2026
 Peter Mwenda·August 13, 2026