
 James Godstime·September 23, 2026

Pi coin price sits near $0.09, 97% below its high. Thin liquidity, token supply, Protocol 28, the OUSD deal, and the levels that matter- all dated and sourced.
Pi coin price did very little on Friday. As of 15:10 UTC on October 2, PI sat at $0.0903 on OKX spot. The day’s range so far ran from 0.08965 to 0.09183.
Quiet is relative, though. CoinMarketCap lists a market cap near $1.01B and only $5.41M of 24-hour volume. Its February 26, 2025 peak, $2.98, is 97% away.
Two bits of Pi news landed in the past week anyway, and the Pi coin price ended the stretch about where it began.
The slide came in lumps. Monday, July 13 closed 14.8% lower on OKX. Tuesday, July 14 printed the low at $0.0703. Turnover on the exchange that Monday was about $11.4M, more than four times the September daily average there.
Why it happened isn’t settled. Third-party reports blamed holder selling and monthly token unlocks. Nothing Pi published ties either one to that day, and POSSIBLE is as far as the evidence goes.
Price never traded back under that low. It poked at the zone twice, Thursday, July 16 (0.07232) and Tuesday, July 28 (0.07297). Then it climbed into a 0.080 to 0.100 band and stayed. Saturday, August 22 spiked to $0.1109 and closed at $0.0904, a full round trip in one day.
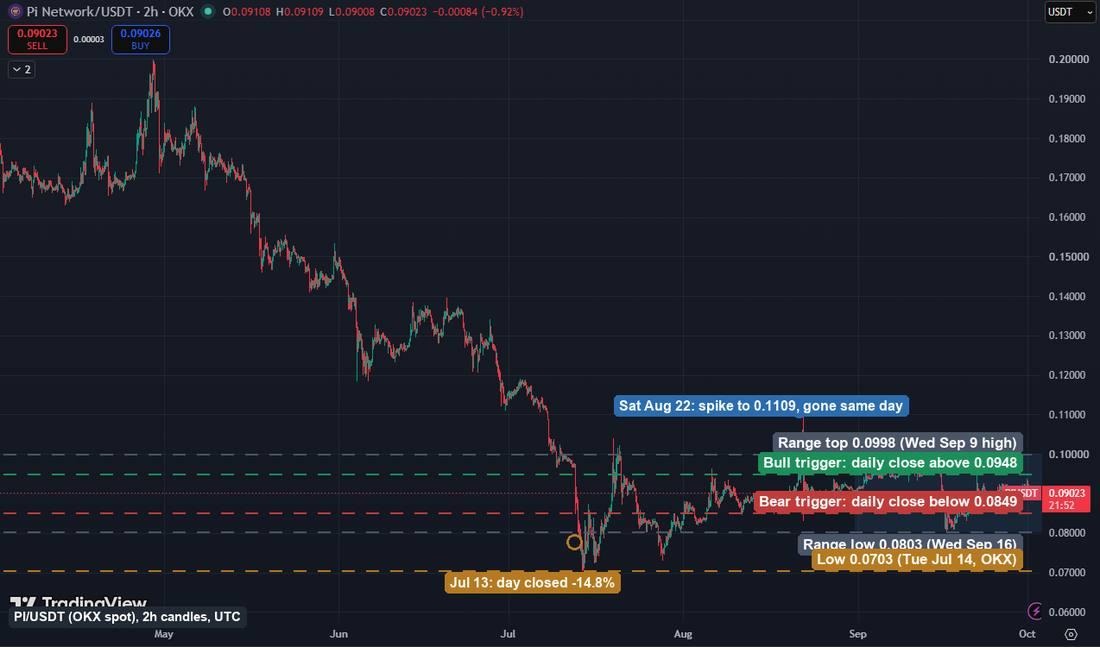
PI/USDT 2-hour chart on OKX, May to October 2, 2026. Source: TradingView
The latest leg down began Tuesday, September 15. At 18:00 UTC, PI fell from 0.09457 to 0.0886 inside an hour. The low came at 17:00 UTC on Wednesday, $0.0803, which is 18.7% under the September 14 high of $0.0988.
The Fed raised its target range a quarter point, to 3.75% to 4%, at 18:00 UTC that Wednesday, per its own statement. PI had bottomed in the hour before and closed that hour higher at 0.08298. That makes the hike a poor explanation for the low. What hit the coin at 18:00 UTC on Tuesday isn’t confirmed anywhere checkable.
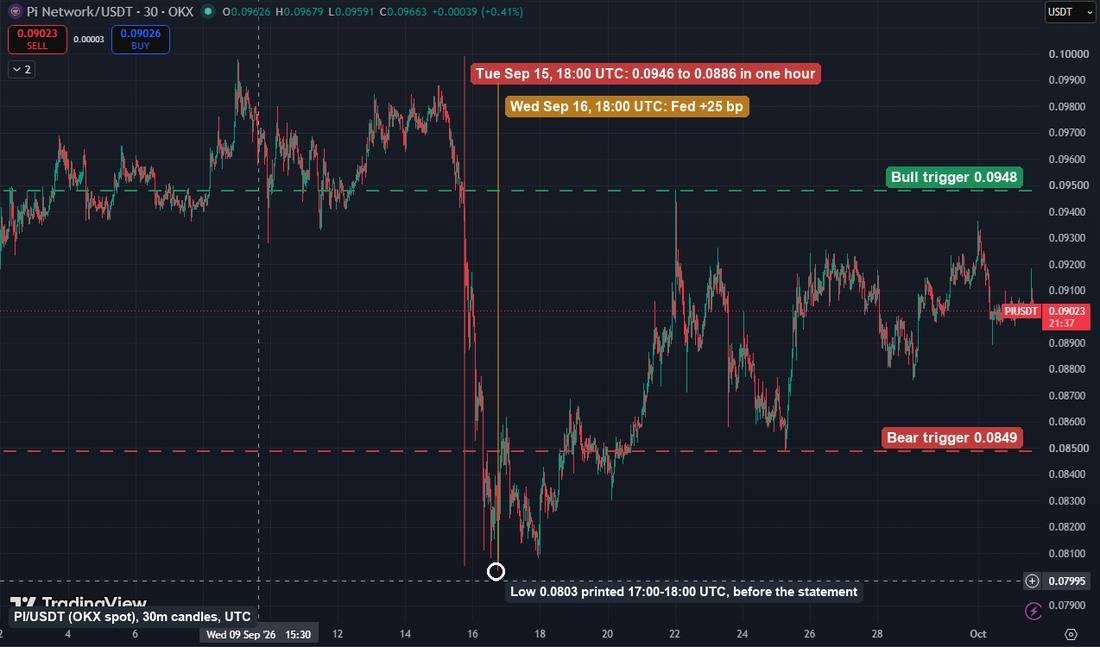
PI/USDT 30-minute chart on OKX, September 1 to October 2, 2026. Source: TradingView
Thin order books matter more to the Pi coin price than any chart pattern. CoinMarketCap’s exchange table showed OKX with about $102,500 of resting orders within 2% above price and $236,900 within 2% below. That was mid-afternoon UTC on October 2. Kraken’s pair showed $1,381 and $6,227.
OKX carried about 38% of reported volume, Gate 14% and Bitget 8%. Binance, Coinbase, Bybit and KuCoin don’t list PI spot. Binance’s API rejected the PIUSDT symbol on October 2 and Coinbase returned not found for PI-USD. The Bybit and KuCoin checks came back empty.
Leveraged bets are small anyway. Open interest, the total of open leveraged positions, was about $2.5M on OKX. Bitget showed roughly $5.3M and Gate $1.3M. That’s around $9M together, under 1% of the market cap.
Funding was 0.005% on OKX and Gate and minus 0.0288% on Bitget at 15:10 UTC. Those are snapshots with no verdict attached.
Per CoinMarketCap, 11.24B PI circulate out of a 100B maximum, or 11.2%. Fully diluted value is $9.02B. That’s about nine times the market cap.
Release schedules for locked balances come from third-party trackers, not Pi’s blog. Those trackers put monthly releases near 128M PI. At today’s price, that’s around $11.5M a month, or $0.38M a day, roughly 7% of daily volume. PiScan showed a maintenance page on October 2, and the figure remains unconfirmed.
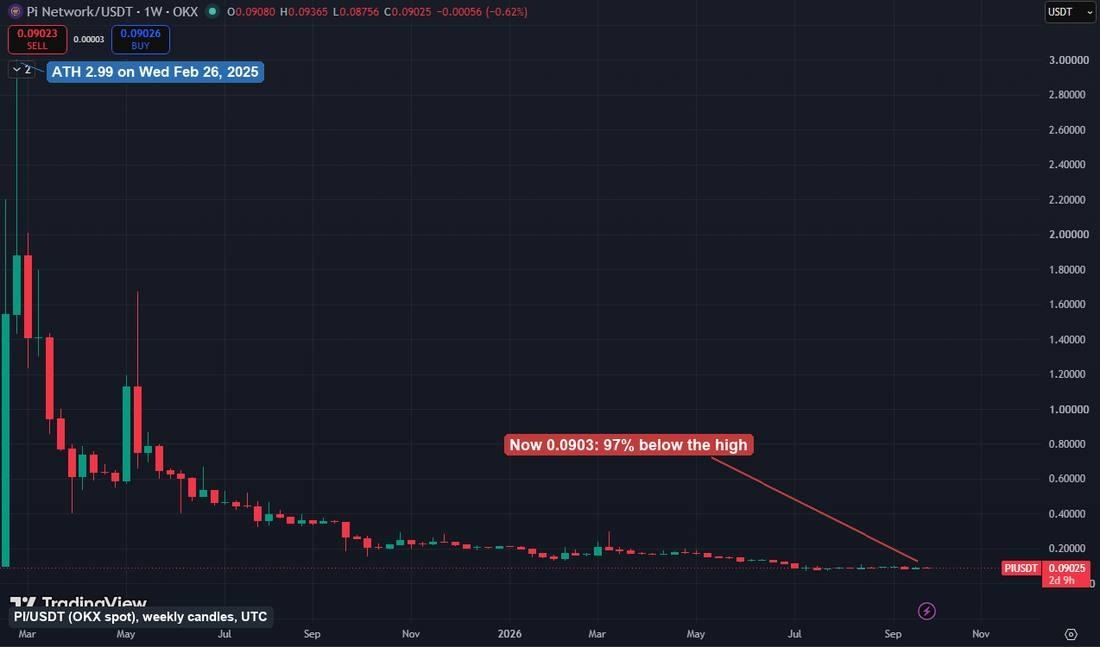
PI/USDT weekly chart on OKX, full history. Source: TradingView
Pi Core Team posted at 23:24 UTC on Friday, September 25 that its testnet had moved to Protocol 28 after Protocol 27 finished on mainnet. Node operators must upgrade by October 13. The mainnet switch is set for October 16. Pi describes it as better handling of transaction-data delays plus safer batch upgrades for smart contracts.
The partnership came five days later. At 17:45 UTC on Wednesday, September 30, Pi’s X account said it’s working with Open Standard, the company behind Open USD, a partner-governed stablecoin. Pi’s post says Open Standard counts 200+ partners, Visa, Google and Stripe among them. Pi will explore rewards for Pioneers and wider use, with details to follow. That’s intent, not a product.
PI traded at 0.09115 when the post went up. It touched 0.09332 early Thursday, then closed Thursday at 0.09002, under where it started.
Pi’s blog shows steady shipping. A September 4 post added local storage for a set of whitelisted apps, a staking-data API and file sharing, plus one documentation site. Pi Desktop 0.6.3 followed on September 9 with SoloHost app rankings by active users and a My Apps page. Neither post gives app or user counts. Those are the numbers a price-watcher would want most.
KYC and migration got fixes too. A September 17 post says 417,000 accounts flagged as possible duplicates can move forward in KYC. It also promised a fix within a week for 497,000 Fast-Track wallets stuck without gas to claim migrated balances. The blog index on October 2 showed no later post confirming it shipped.
Here’s where the averages sit through Thursday’s close. PI is under the 100-day (0.0935, still falling) and the 200-day (0.1278, falling too). The 50-day at 0.0910 is a hair overhead; the 20-day at 0.0897 is just underneath. Off the 20-day high of 0.0988, it’s down 8.6%, and it sits 6.4% above the 10-day low of 0.0849. Range, in other words, not a breakout.
Bulls need a daily close over $0.0948, which was the high on Tuesday, September 22. That opens $0.0988 first, then $0.0998 from the September 9 high. If PI slips back under $0.0937 on a daily close (the September 30 high), the case is off.
Bears need a daily close under $0.0849, Friday, September 25’s low. First stop would be $0.0803, then $0.0703. A daily close back over $0.0881, the September 23 close, cancels it.
Between those lines, neither case is live, and the scenario block is the whole call. Short term it’s balanced. Trend regime is the one input with tested backing. Bitcoin at $85,394 sat above its rising 100-day average of $70,770, while PI sat under its own. That leans toward the bear case, though only a close under 0.0849 would make it live.
Dates that can move volume either way, direction unknown, are the October 13 node deadline and the October 16 mainnet switch.
The Pi coin price hasn’t followed the market’s lead. CoinGecko lists it down 3.8% over 30 days, while the Binance Bitcoin perpetual is up 10.5%. Bitcoin’s own case is in LBN’s Citi target piece, and Ether’s key test sits in the Ethereum price analysis.
The rate backdrop is the Fed’s 3.75% to 4% range after the September 16 hike. More on the rest of the altcoins market sits in LBN’s coverage.
None of this is financial or investment advice. It’s a read of price, liquidity, and public project updates as of 15:40 UTC on Friday, October 2, 2026. Any of it can go stale within hours.
Related News
Explore more