
XRP Ledger Rolls Out 3.4.0 With New Lending Protocol Changes
 Peter Mwenda·1hr ago

XRP and XLM are both retesting broken support zones as resistance this week, and how each level breaks could set the tone into the weekend.
Something quietly important is playing out on the XRP chart this week, and it has nothing to do with a filing or a partnership announcement. For most of September, the token held a tight floor between $1.31 and $1.33, bouncing off it again and again. That held right up until Tuesday, September 15, when a sharp pullback dropped price below the zone entirely.
The bounce back happened fast. Within a day and a half or so, XRP’s price climbed right back up to that same $1.31 to $1.33 pocket, except now it’s pressing against it from underneath, testing what used to be a floor as a ceiling.
That kind of setup, an old support zone getting retested as resistance, tends to matter more than it looks on a quiet chart. Getting rejected here points toward a slide back down into the $1.22 area, and depending on how hard sellers push, the pullback could run anywhere from roughly 6% on the shallow end to 10% or so if the move turns ugly. A clean break through the zone instead opens a path toward $1.39 to $1.43, the upper edge of the same multi-week range.
Right now, honestly, it reads like a coin flip. Neither side has won yet.
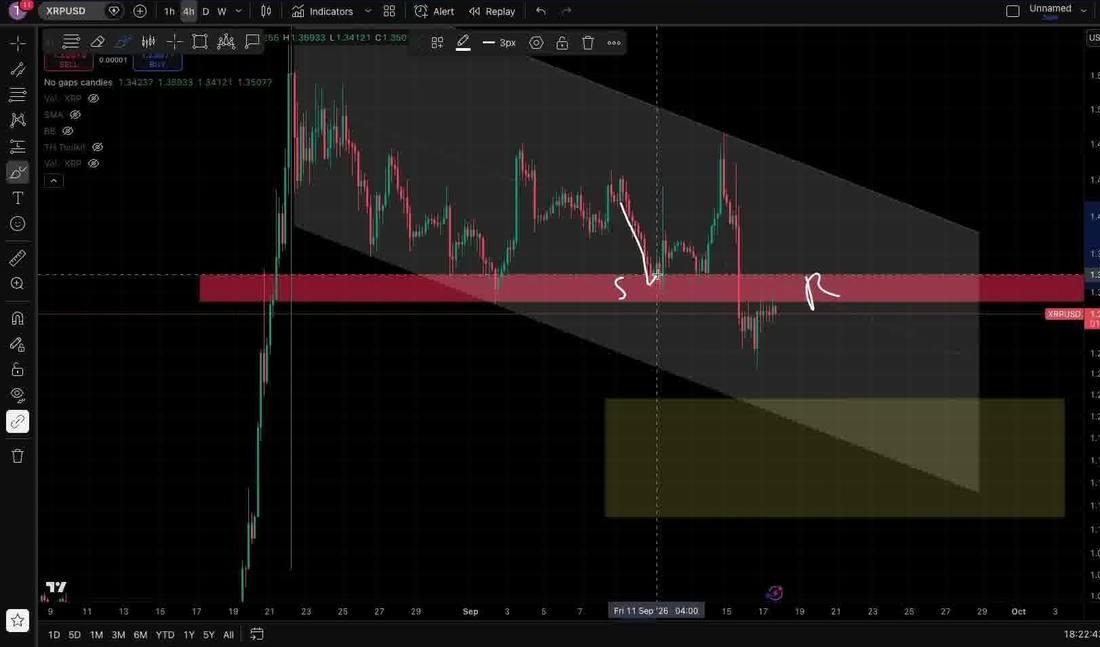
Source: TradingView XRP retesting the $1.31 to $1.33 zone from below on TradingView, the same level that held as support through most of September before breaking down.
Stellar’s XLM has been fighting a nearly identical battle since late August, just on a smaller scale. It held support around $0.176 to $0.178 through several tests, and every bounce off that floor has run straight into a wall of resistance sitting just above it.
There are actually two resistance shelves stacked on top of each other there, one close to $0.186 to $0.189, another sitting right above it. The rejections off that first shelf haven’t been gentle. One pullback ran close to 12%, another came in just under 13%, both sizable moves off a level that looks unassuming on a daily chart.
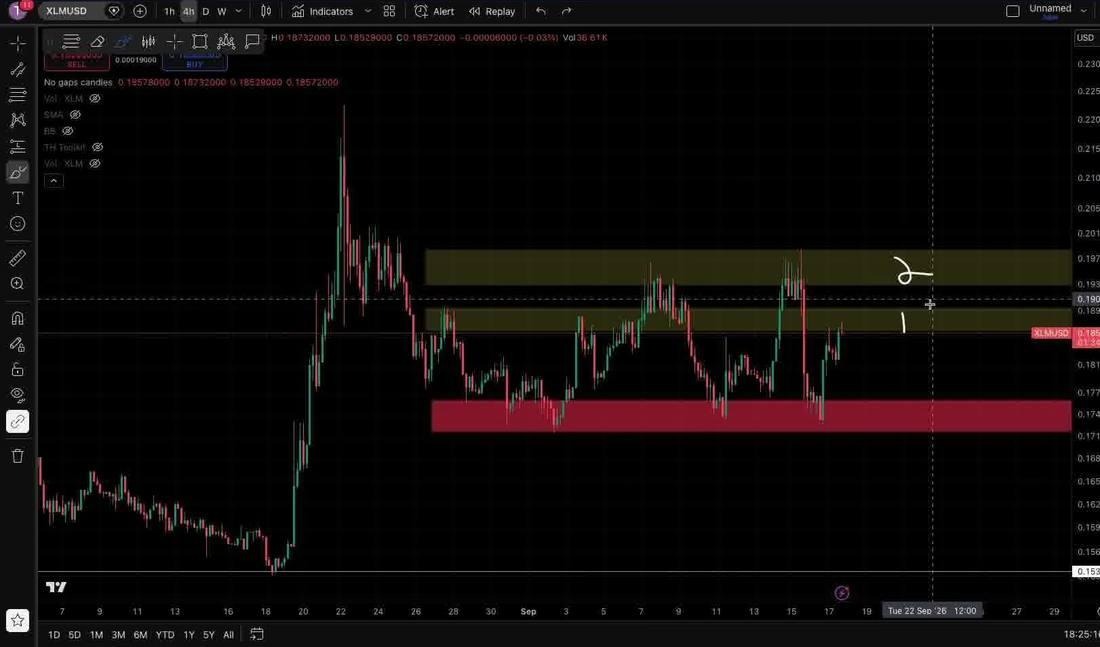
Source: TradingView XLM stacked against its two-tier resistance shelf on TradingView, the zone that has triggered double-digit pullbacks on each of its last two tests.
XLM is retesting that lower shelf again this week. Clear both walls and 22 cents becomes a realistic target. Fail here again, though, and price likely drifts back toward the mid 17-cent range, with each failed attempt raising the odds of eventually losing the $0.176 floor and opening risk toward $0.14 to $0.16.
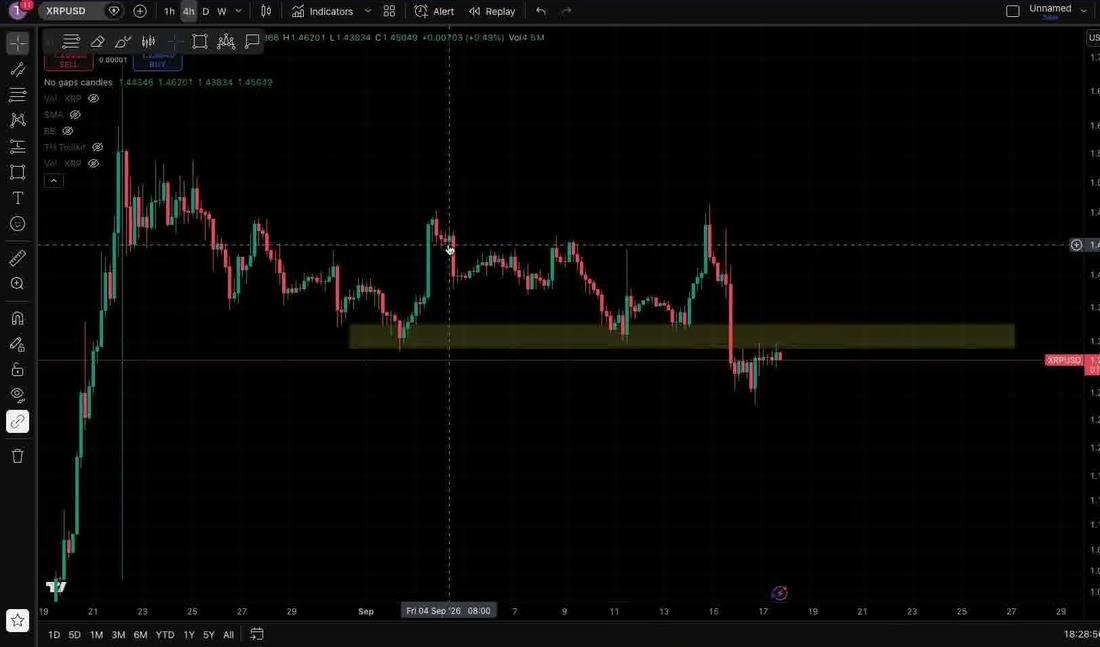
Source: TradingView XRP’s broader consolidation range on TradingView, with the $1.32 to $1.34 pocket sitting at the center of this week’s decision.
In moments like this, buying or selling either token is close to a coin flip, and treating a coin flip like a strategy rarely ends well. The steadier play, at least on paper, is waiting for one side of these zones to actually win before committing capital. That’s not bearish. It’s not bullish either. It just means the market hasn’t decided yet.
Both charts share a longer running theme underneath all this. Buyers have shown up at these exact support shelves repeatedly over the past month, and the broader structure on XRP and XLM has held through worse drops than this one, which counts for something even with the short-term caution in play.
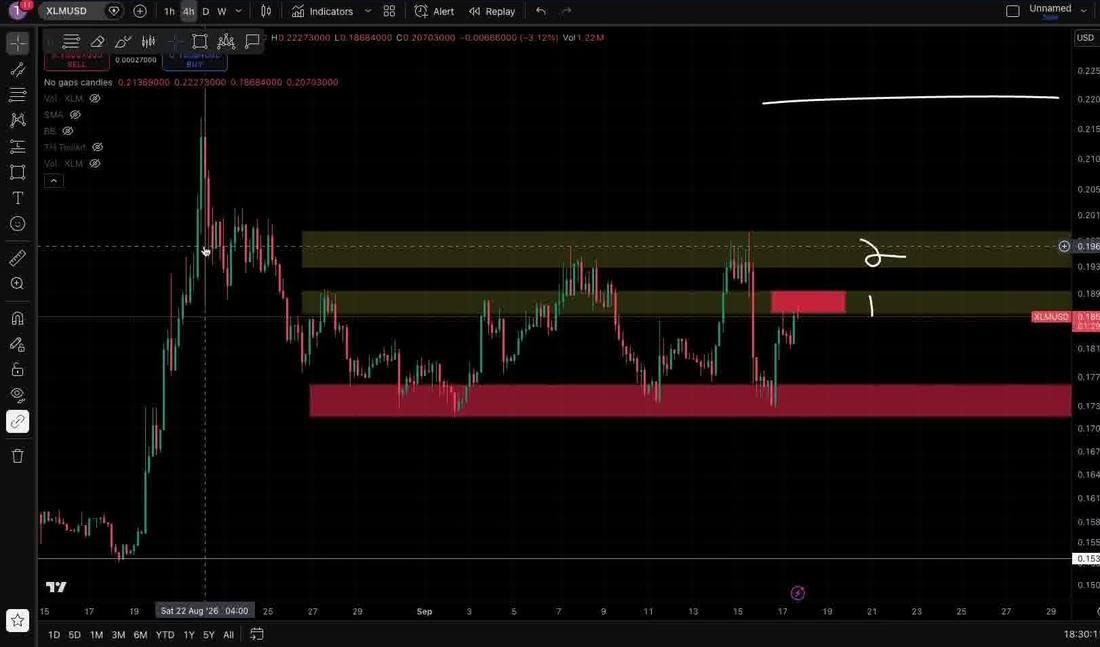
Source: TradingView XLM retesting the lower edge of its resistance shelf on TradingView, the zone now deciding whether the next leg runs toward 22 cents or back below 17.
The backdrop matters too. Ethereum’s own chart has been working through a comparable trendline retest of its own this week, a reminder that this kind of decision point isn’t unique to XRP or Stellar right now.
Regulatory clarity has been improving in parallel. The SEC’s move toward a temporary framework for blockchain-powered securities landed just hours before this latest test on both charts got underway.
None of this is financial advice, just a plain read of what the charts are showing. Whichever way these zones break in the coming days, on the current setup, the move looks unlikely to be a quiet one.
Peter Mwenda·1hr ago
 Jayanand Sagar·September 4, 2026
 Peter Mwenda·August 28, 2026