

Stellar XLM Eyes Fresh Momentum as Institutions Rediscover Its Payment Edge
 Samuel·July 27, 2026
Bitcoin cash price is currently facing a strong resistance near the $245 level against the US Dollar. The price is currently correcting lower and approaching the $230 support zone. There is a major bullish trend line forming with support near $230 on the 4-hours chart of the BCH/USD pair (data feed from Coinbase). The pair […]
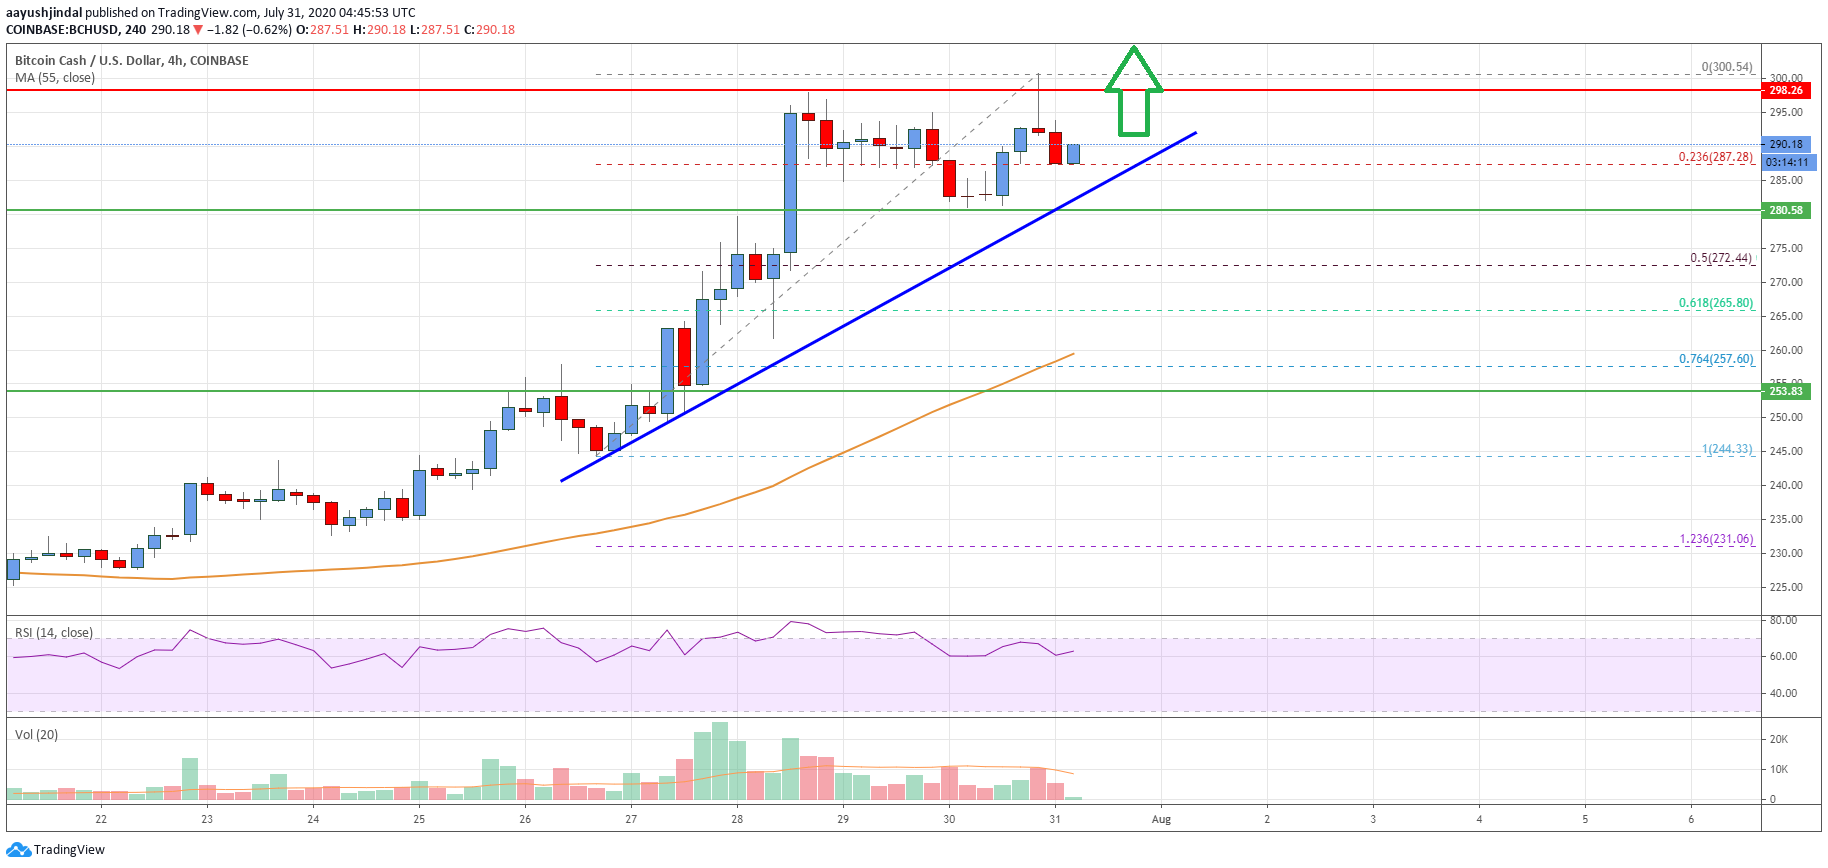
Bitcoin cash price is correcting gains from the $245 hurdle against the US Dollar. BCH/USD is likely to bounce back as long as it is above the $230 support zone.
Earlier this week, bitcoin cash price started a fresh increase above the $225 and $230 resistance levels against the US Dollar. BCH price even settled above the $230 level and the 55 simple moving average (4-hours).
Finally, the price spiked above the $240 level and it is currently facing a strong resistance near the $245 level. A high is formed near the $245 level and the price is currently correcting lower.
There was a break below the $240 level, plus the 23.6% Fib retracement level of the recent increase from the $215 swing low to $245 high. The price is now trading below the $236 level and it is approaching the main $230 support zone.
There is a major bullish trend line forming with support near $230 on the 4-hours chart of the BCH/USD pair. The trend line is close to the 50% Fib retracement level of the recent increase from the $215 swing low to $245 high.
More importantly, the 55 simple moving average (4-hours) is also near the trend line support at $230. If bitcoin cash price fails to stay above the trend line support and $230, there is a risk of a nasty decline in the coming sessions.
Conversely, the price might bounce back above the $240 and $242 levels. The main resistance is near the $245 level. A successful close above the $245 level might trigger a sharp rally towards $255 and $260.
Looking at the chart, bitcoin cash price is correcting lower from the $245 barrier. It must stay above the $230 support to make another attempt to clear the $245 resistance.
4 hours MACD – The MACD for BCH/USD is currently gaining momentum in the bearish zone.
4 hours RSI (Relative Strength Index) – The RSI for BCH/USD is now below the 50 level.
Key Support Levels – $230 and $215.
Key Resistance Levels – $240 and $245.
Samuel·July 27, 2026 Samuel·July 27, 2026
 Samuel·July 26, 2026